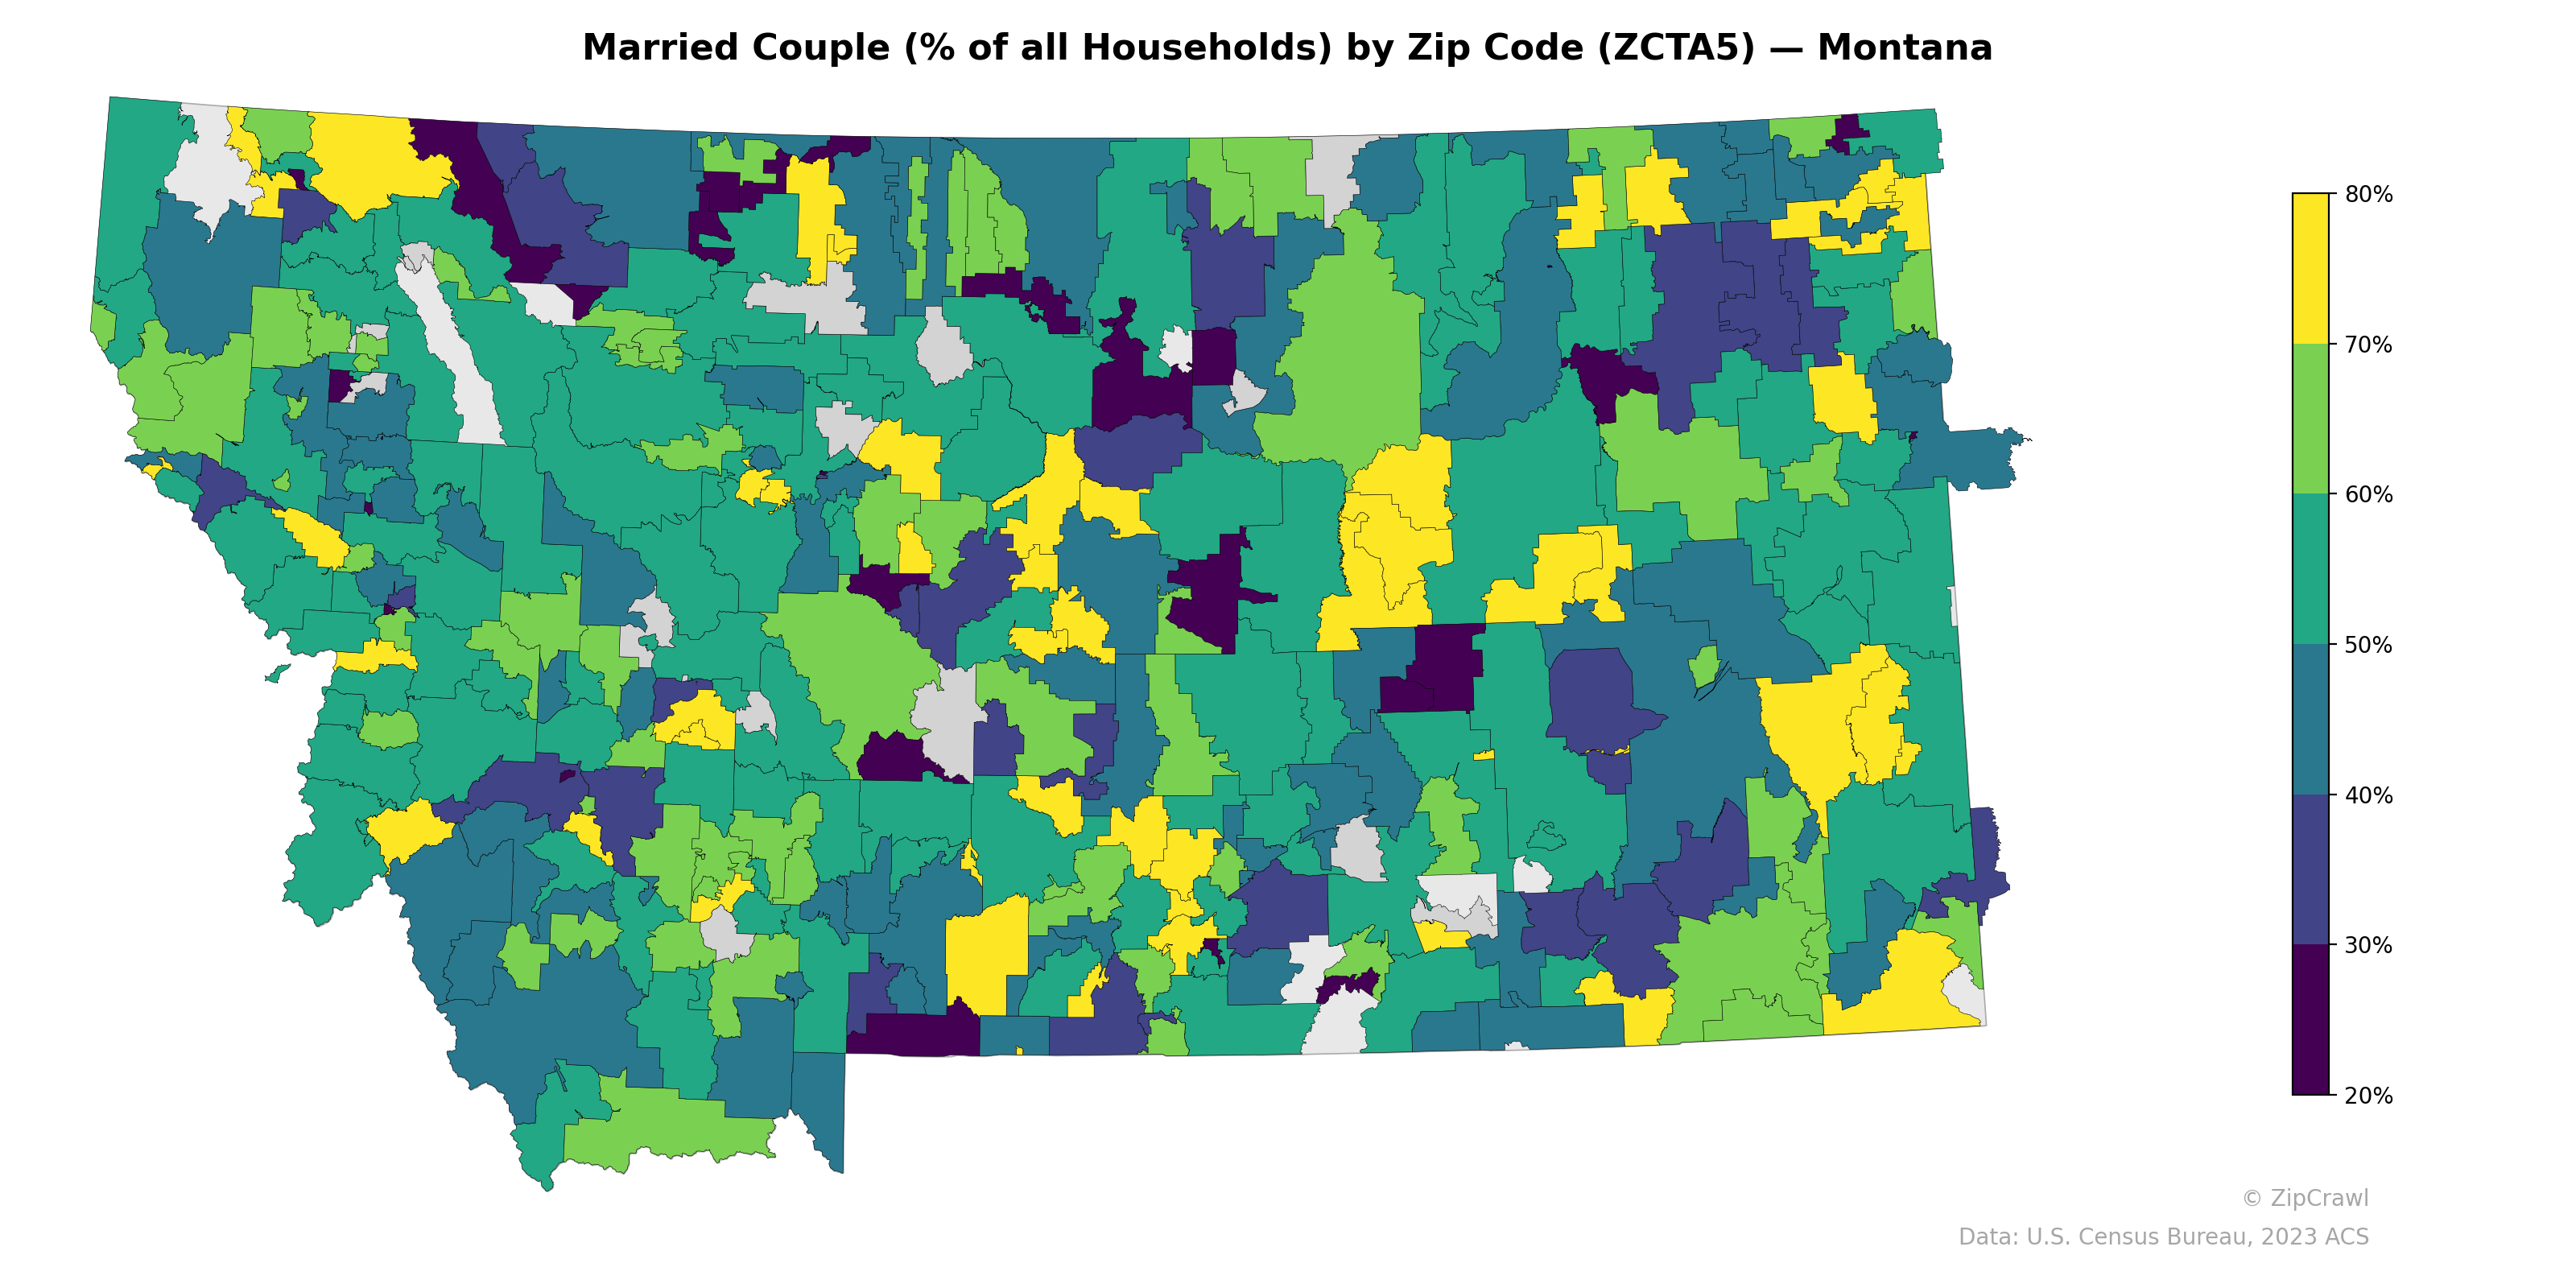
NOTE: Gray indicates insufficient data or a suppressed estimate.
Rural zip codes across Montana's eastern plains and northern tier generally exhibit higher married-couple household percentages, frequently reaching 70–80%, consistent with agricultural communities where family-operated ranches predominate. In contrast, zip codes encompassing urban centers such as Missoula, Great Falls, Billings, and several tribal reservation areas in the north-central and southeastern portions of the state display notably lower rates, often falling below 40%, appearing as dark purple clusters amid the surrounding higher-value regions. The western mountain corridor shows considerable heterogeneity, with adjacent zip codes sometimes differing by 20–30 percentage points, likely reflecting the mix of resort towns, university communities, and more rural residential areas.
Data: U.S. Census Bureau, 2023 ACS
Explore
- High School Graduate (% of Over 25) by Zip Code (ZCTA5) — New York
- Population Non-Hispanic Black % by Zip Code (ZCTA5) — Rhode Island
- U.S. Citizens (% of Population Over 18) by Zip Code (ZCTA5) — Rhode Island
- % of Population on Food Stamps or SNAP (Last 12 Months), by Zip Code (ZCTA5) — Montana
- Housing Vacancy Rate by Zip Code (ZCTA5) — Montana
- Population Hispanic % by Zip Code (ZCTA5) — Rhode Island
- Population Non-Hispanic White % by Zip Code (ZCTA5) — Rhode Island
- Median Age by Zip Code (ZCTA5) — Rhode Island
- Household Median Income by Zip Code (ZCTA5) — Rhode Island
- Population Non-Hispanic Asian % by Zip Code (ZCTA5) — Montana
- U.S. Citizens by County (% of Population Over 18)
- Population Non-Hispanic Black % by Zip Code (ZCTA5) — New York
- Population Non-Hispanic American Indian % by Zip Code (ZCTA5) — New York
- Bachelor's Degree or Higher (% of Over 25) by Zip Code (ZCTA5) — Arizona
- Household Median Income by Zip Code (ZCTA5) — New York
- Median Age by Zip Code (ZCTA5) — New York
- % of Population on Food Stamps or SNAP (Last 12 Months), by Zip Code (ZCTA5) — Florida
- Bachelor's Degree or Higher (% of Over 25) by Zip Code (ZCTA5) — Pennsylvania
- Population Hispanic % by Zip Code (ZCTA5) — New York
- Population Non-Hispanic Asian % by Zip Code (ZCTA5) — Florida
- Population Non-Hispanic White % by Zip Code (ZCTA5) — New York
- U.S. Citizens (% of Population Over 18) by Zip Code (ZCTA5) — New York
- % of Households with Broadband Internet, by Zip Code (ZCTA5) — West Virginia
- High School Graduate (% of Over 25) by Zip Code (ZCTA5) — West Virginia
- Population Non-Hispanic Asian % by Zip Code (ZCTA5) — West Virginia
- Population Hispanic % by Zip Code (ZCTA5) — Hawaii
- % of Population without Health Insurance, by Zip Code (ZCTA5) — West Virginia
- Population Non-Hispanic American Indian % by Zip Code (ZCTA5) — West Virginia
- Bachelor's Degree or Higher (% of Over 25) by Zip Code (ZCTA5) — West Virginia
- Housing Vacancy Rate by Zip Code (ZCTA5) — West Virginia
- Married Couple (% of all Households) by Zip Code (ZCTA5) — Indiana
- Married Couple (% of all Households) by Zip Code (ZCTA5) — Vermont
- Married Couple (% of all Households) by Zip Code (ZCTA5) — Maine
- Married Couple (% of all Households) by Zip Code (ZCTA5) — Ohio
- Married Couple (% of all Households) by Zip Code (ZCTA5) — Arizona
- Married Couple (% of all Households) by Zip Code (ZCTA5) — Alaska
- Married Couple (% of all Households) by Zip Code (ZCTA5) — Utah
- Married Couple (% of all Households) by Zip Code (ZCTA5) — Iowa
- Married Couple (% of all Households) by Zip Code (ZCTA5) — Louisiana
- Married Couple (% of all Households) by Zip Code (ZCTA5) — Alabama