NOTE: Gray indicates insufficient data or a suppressed estimate.
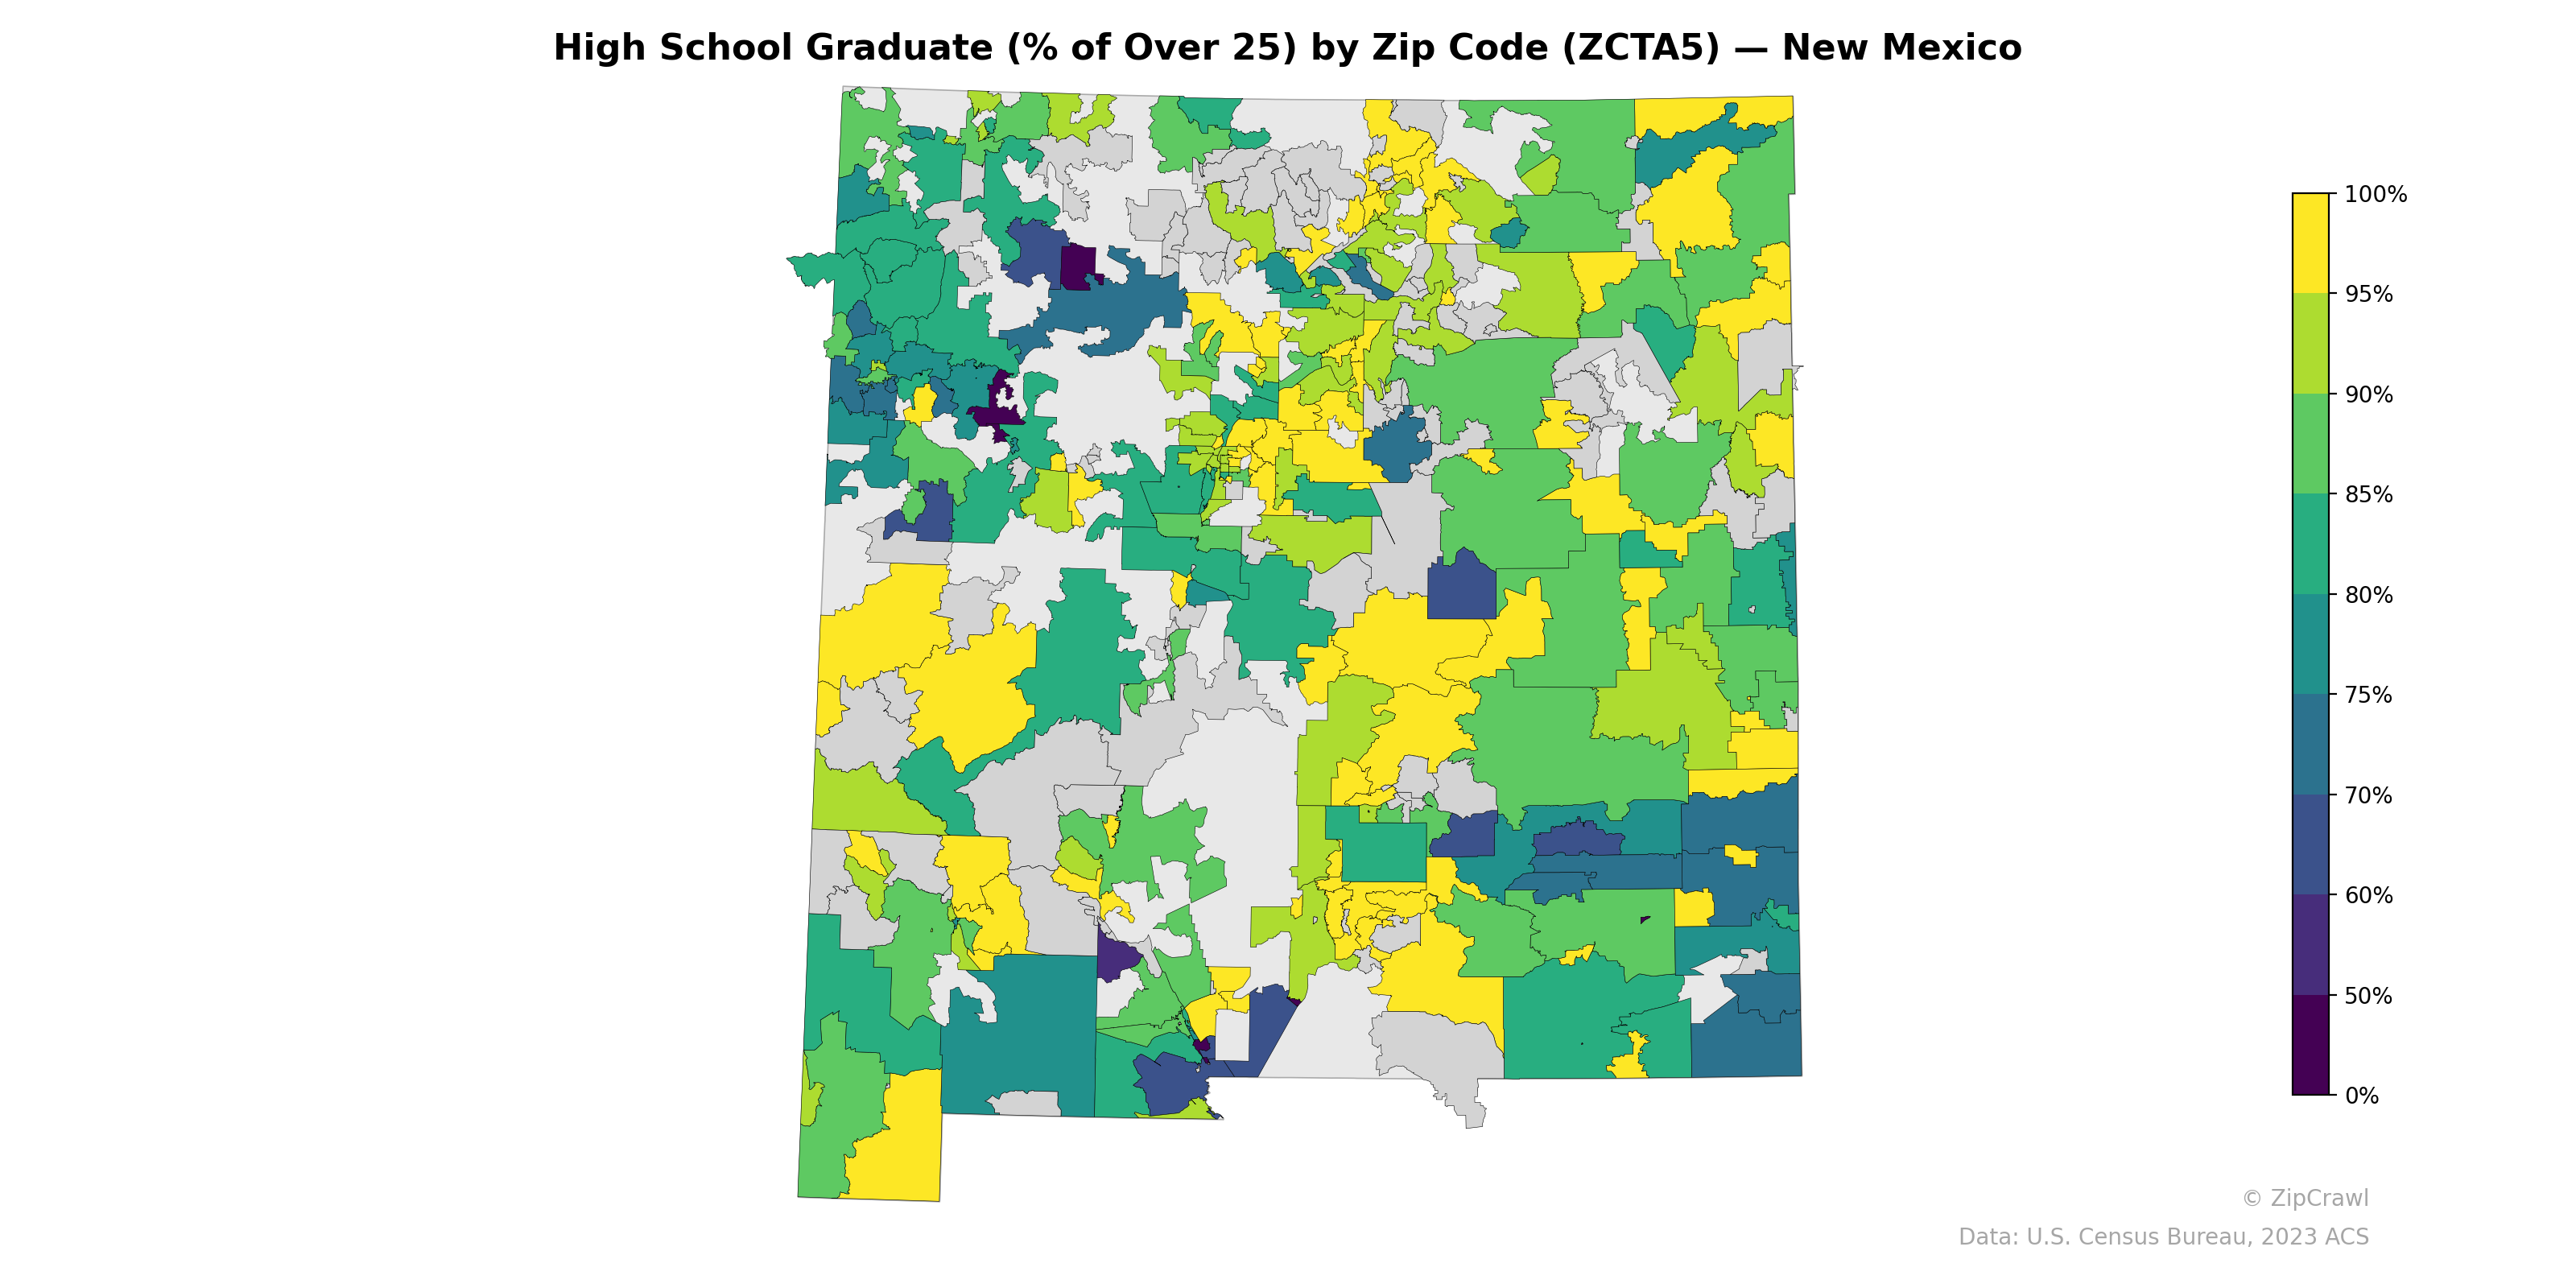
High school graduation rates across New Mexico exhibit stark geographic disparities, with the northwestern region—encompassing Navajo Nation and other tribal lands—displaying notably lower attainment levels (many zip codes below 75%), while suburban areas around Albuquerque and Santa Fe consistently reach 90% or above. The southern border region near Las Cruces and the far southeast also show pockets of lower educational attainment, contrasting with higher-performing zip codes in the eastern plains and select mountain communities. Several isolated zip codes in the central and south-central parts of the state fall into the lowest quintiles (below 50%), likely corresponding to small, rural communities or tribal areas with historically limited educational infrastructure.
Data: U.S. Census Bureau, 2023 ACS
Explore
- Housing Owner-Occupied Median Value ($), by Zip Code (ZCTA5) — Florida
- Housing % of Units Built Since 2010, by Zip Code (ZCTA5) — New Mexico
- Housing Median Monthly Rent ($), by Zip Code (ZCTA5) — New Mexico
- Housing Owner-Occupied Median Value ($), by Zip Code (ZCTA5) — New Mexico
- Population Non-Hispanic American Indian % by Zip Code (ZCTA5) — New Mexico
- Household Average Size by Zip Code (ZCTA5) — New Mexico
- Housing Owner-Occupied % of Units, by Zip Code (ZCTA5) — New Mexico
- % of Households with Broadband Internet, by Zip Code (ZCTA5) — New Mexico
- % of Population without Health Insurance, by Zip Code (ZCTA5) — New Mexico
- Bachelor's Degree or Higher (% of Over 25) by Zip Code (ZCTA5) — New Mexico
- Housing Median Monthly Rent ($), by County
- Housing Vacancy Rate by Zip Code (ZCTA5) — Florida
- % of Population on Food Stamps or SNAP (Last 12 Months), by Zip Code (ZCTA5) — Florida
- Married Couple (% of all Households) by Zip Code (ZCTA5) — Florida
- % of Population on Food Stamps or SNAP (Last 12 Months), by Zip Code (ZCTA5) — Michigan
- Housing Median Monthly Rent ($), by Zip Code (ZCTA5) — Florida
- Housing Owner-Occupied % of Units, by Zip Code (ZCTA5) — Florida
- Housing % of Units Built Since 2010, by Zip Code (ZCTA5) — Florida
- Bachelor's Degree or Higher (% of Over 25) by Zip Code (ZCTA5) — Florida
- % of Population without Health Insurance, by Zip Code (ZCTA5) — Florida
- % of Households with Broadband Internet, by Zip Code (ZCTA5) — Florida
- Household Average Size by Zip Code (ZCTA5) — Florida
- Population Non-Hispanic Asian % by Zip Code (ZCTA5) — Mississippi
- % of Population without Health Insurance, by Zip Code (ZCTA5) — Mississippi
- % of Population on Food Stamps or SNAP (Last 12 Months), by Zip Code (ZCTA5) — Mississippi
- Median Age by Zip Code (ZCTA5) — Idaho
- Bachelor's Degree or Higher (% of Over 25) by Zip Code (ZCTA5) — Mississippi
- Population Non-Hispanic American Indian % by Zip Code (ZCTA5) — Mississippi
- % of Households with Broadband Internet, by Zip Code (ZCTA5) — Mississippi
- Housing Owner-Occupied % of Units, by Zip Code (ZCTA5) — Mississippi
- High School Graduate (% of Over 25) by Zip Code (ZCTA5) — New York
- High School Graduate (% of Over 25) by Zip Code (ZCTA5) — New York Metro
- High School Graduate (% of Over 25) by Zip Code (ZCTA5) — New Jersey
- High School Graduate (% of Over 25) by Zip Code (ZCTA5) — Nevada
- High School Graduate (% of Over 25) by Zip Code (ZCTA5) — Maine
- High School Graduate (% of Over 25) by Zip Code (ZCTA5) — New Hampshire
- High School Graduate (% of Over 25) by Zip Code (ZCTA5) — Ohio
- High School Graduate (% of Over 25) by Zip Code (ZCTA5) — Nebraska
- High School Graduate (% of Over 25) by Zip Code (ZCTA5) — Utah
- High School Graduate (% of Over 25) by Zip Code (ZCTA5) — Iowa