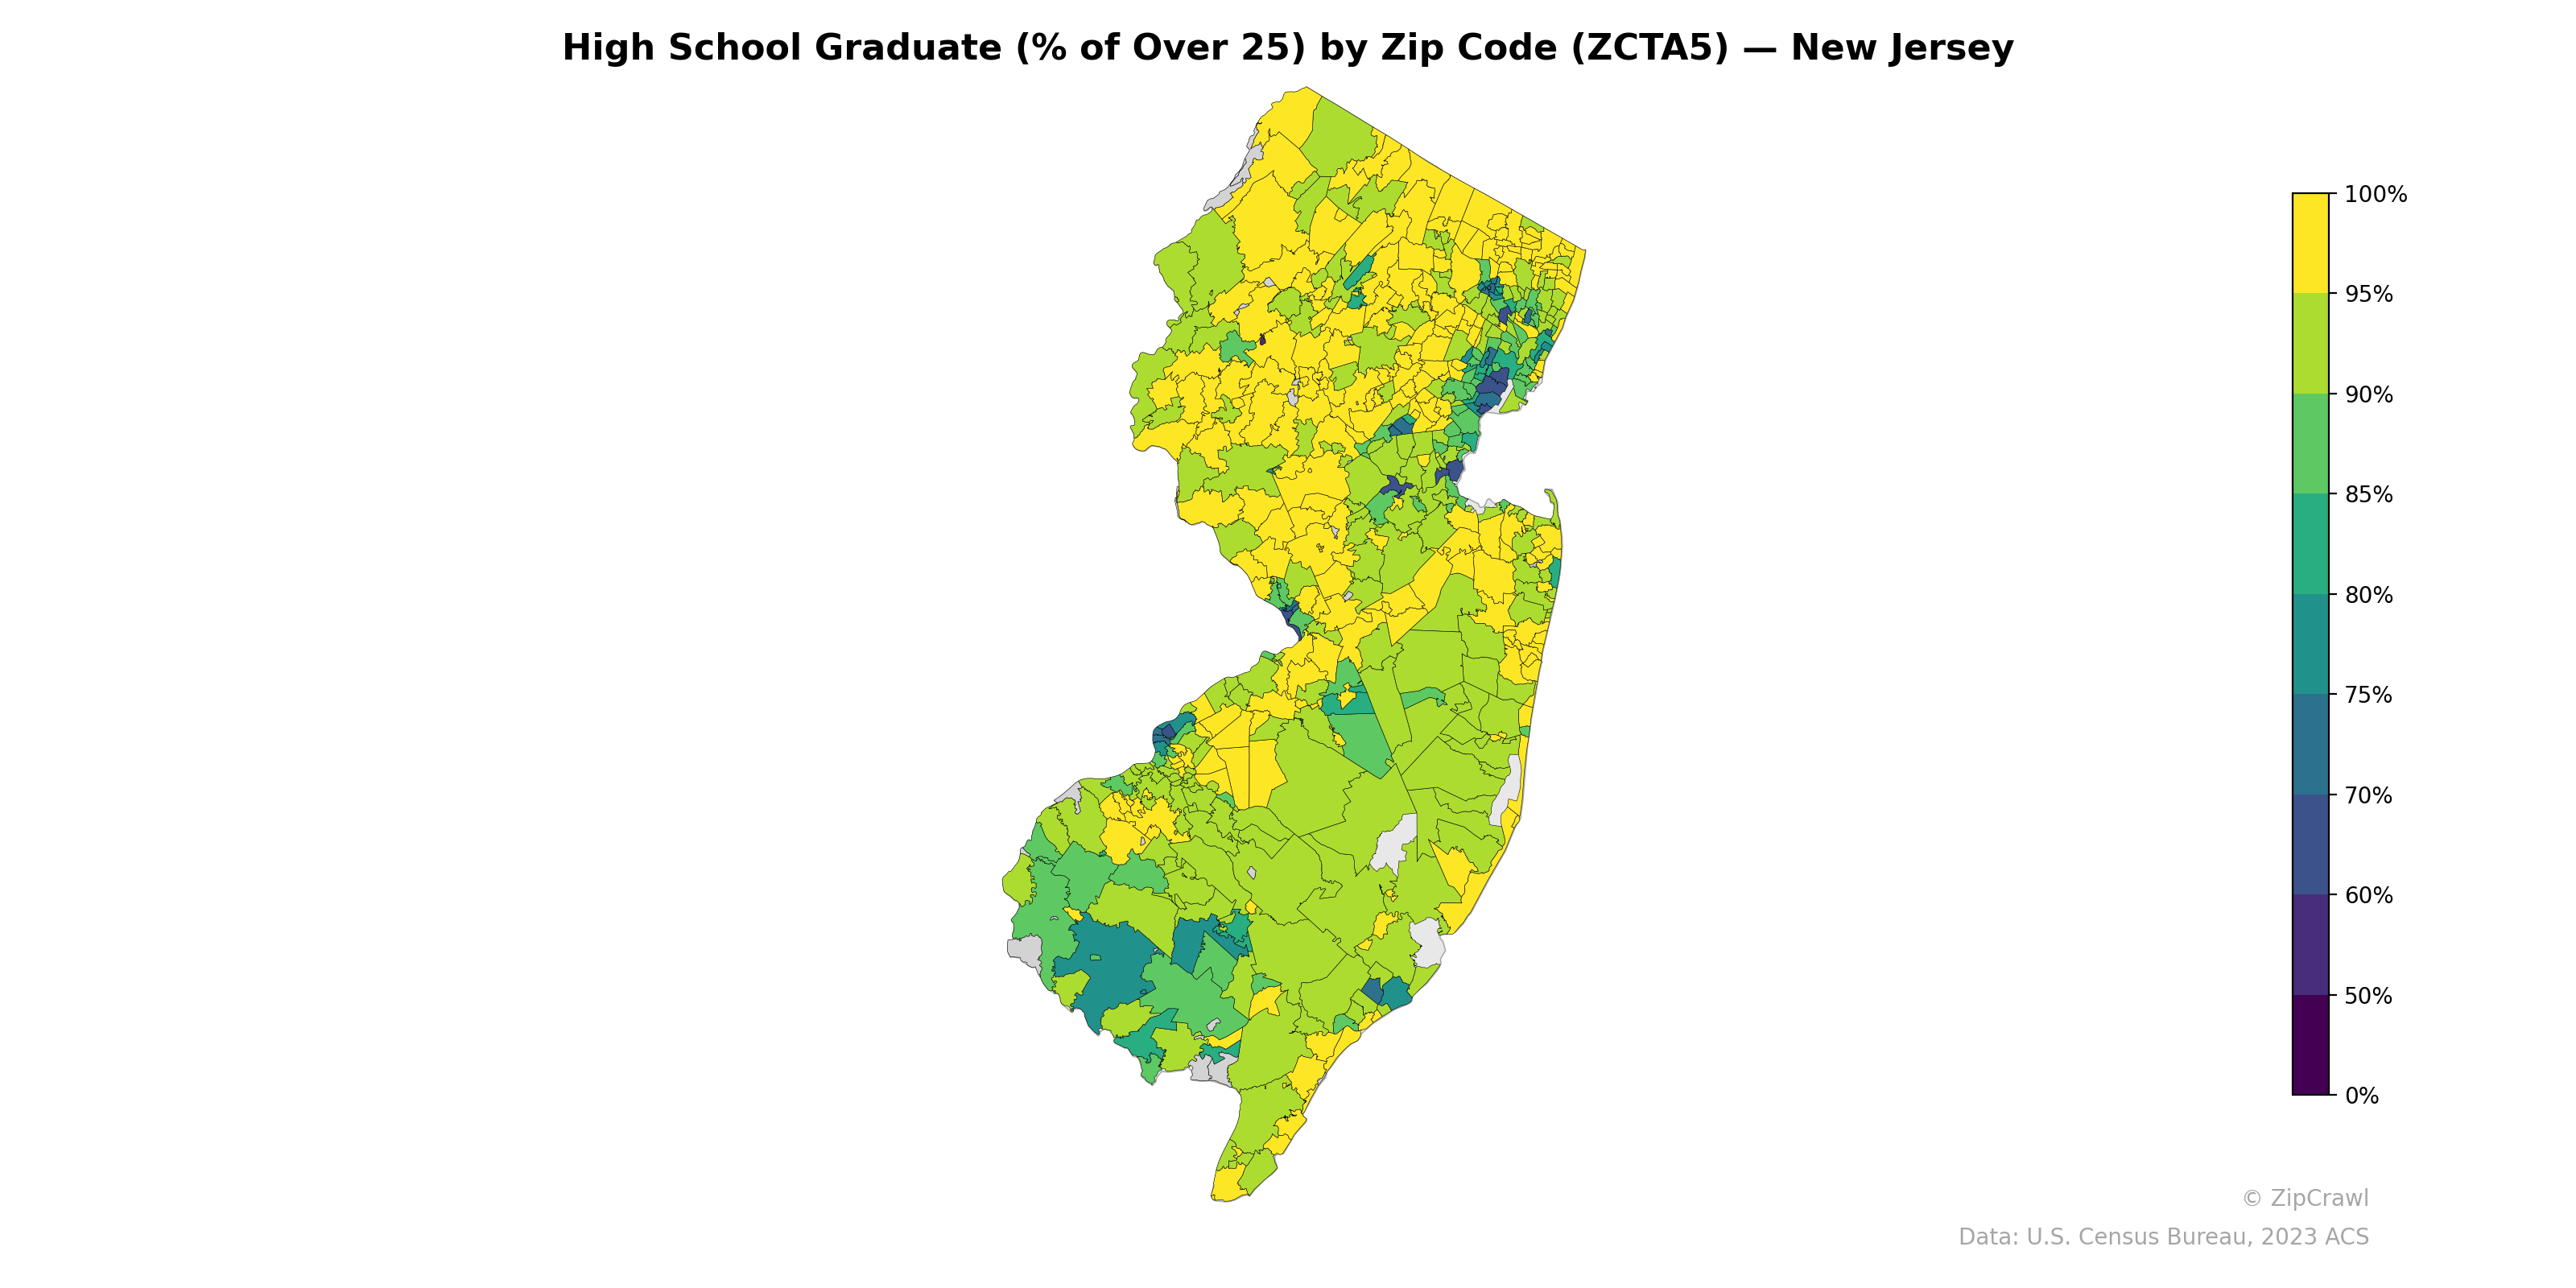
NOTE: Gray indicates insufficient data or a suppressed estimate.
High school graduation rates across New Jersey exhibit a clear north-south divide, with the northern and central suburban zip codes—particularly in Morris, Somerset, and Hunterdon counties—consistently reaching 95–100%, while parts of southern New Jersey, especially in Cumberland and Salem counties, drop notably into the 70–85% range. Urban cores such as Newark, Paterson, Trenton, and Camden stand out as darker-shaded clusters with some of the lowest rates in the state, often falling below 75%. The Atlantic City area in the southeast also displays a pronounced pocket of lower attainment, contrasting sharply with the surrounding suburban and exurban zip codes.
Data: U.S. Census Bureau, 2023 ACS
Explore
- Housing Median Monthly Rent ($), by Zip Code (ZCTA5) — New York Metro
- Population Non-Hispanic American Indian % by Zip Code (ZCTA5) — New Jersey
- Population Non-Hispanic Asian % by Zip Code (ZCTA5) — Michigan
- Population Non-Hispanic Black % by Zip Code (ZCTA5) — New Jersey
- % of Population on Food Stamps or SNAP (Last 12 Months), by Zip Code (ZCTA5) — Michigan
- U.S. Citizens (% of Population Over 18) by Zip Code (ZCTA5) — New Jersey
- Median Age by Zip Code (ZCTA5) — New Jersey
- Population Hispanic % by Zip Code (ZCTA5) — New Jersey
- Population Non-Hispanic White % by Zip Code (ZCTA5) — New Jersey
- Household Median Income by Zip Code (ZCTA5) — New Jersey
- Household Average Size by Zip Code (ZCTA5) — New Mexico
- Population Non-Hispanic White % by County
- % of Population without Health Insurance, by Zip Code (ZCTA5) — New York Metro
- Population Non-Hispanic Asian % by Zip Code (ZCTA5) — New York Metro
- Housing Vacancy Rate by Zip Code (ZCTA5) — New York Metro
- Household Average Size by Zip Code (ZCTA5) — New York Metro
- Housing Owner-Occupied Median Value ($), by Zip Code (ZCTA5) — New York Metro
- % of Households with Broadband Internet, by Zip Code (ZCTA5) — New York Metro
- Housing % of Units Built Since 2010, by Zip Code (ZCTA5) — New York Metro
- Married Couple (% of all Households) by Zip Code (ZCTA5) — New York Metro
- Housing Vacancy Rate by Zip Code (ZCTA5) — North Carolina
- Household Average Size by Zip Code (ZCTA5) — North Carolina
- Population Non-Hispanic Asian % by Zip Code (ZCTA5) — North Carolina
- % of Population without Health Insurance, by Zip Code (ZCTA5) — North Carolina
- % of Households with Broadband Internet, by Zip Code (ZCTA5) — North Carolina
- Housing Owner-Occupied % of Units, by Zip Code (ZCTA5) — North Carolina
- Housing Median Monthly Rent ($), by Zip Code (ZCTA5) — North Carolina
- Housing % of Units Built Since 2010, by Zip Code (ZCTA5) — North Carolina
- Married Couple (% of all Households) by Zip Code (ZCTA5) — North Carolina
- Population Non-Hispanic American Indian % by Zip Code (ZCTA5) — North Carolina
- High School Graduate (% of Over 25) by Zip Code (ZCTA5) — New York
- High School Graduate (% of Over 25) by Zip Code (ZCTA5) — New Mexico
- High School Graduate (% of Over 25) by Zip Code (ZCTA5) — Nevada
- High School Graduate (% of Over 25) by Zip Code (ZCTA5) — New Hampshire
- High School Graduate (% of Over 25) by Zip Code (ZCTA5) — Ohio
- High School Graduate (% of Over 25) by Zip Code (ZCTA5) — Nebraska
- High School Graduate (% of Over 25) by Zip Code (ZCTA5) — Iowa
- High School Graduate (% of Over 25) by Zip Code (ZCTA5) — Utah
- High School Graduate (% of Over 25) by Zip Code (ZCTA5) — New York Metro
- High School Graduate (% of Over 25) by Zip Code (ZCTA5) — Colorado