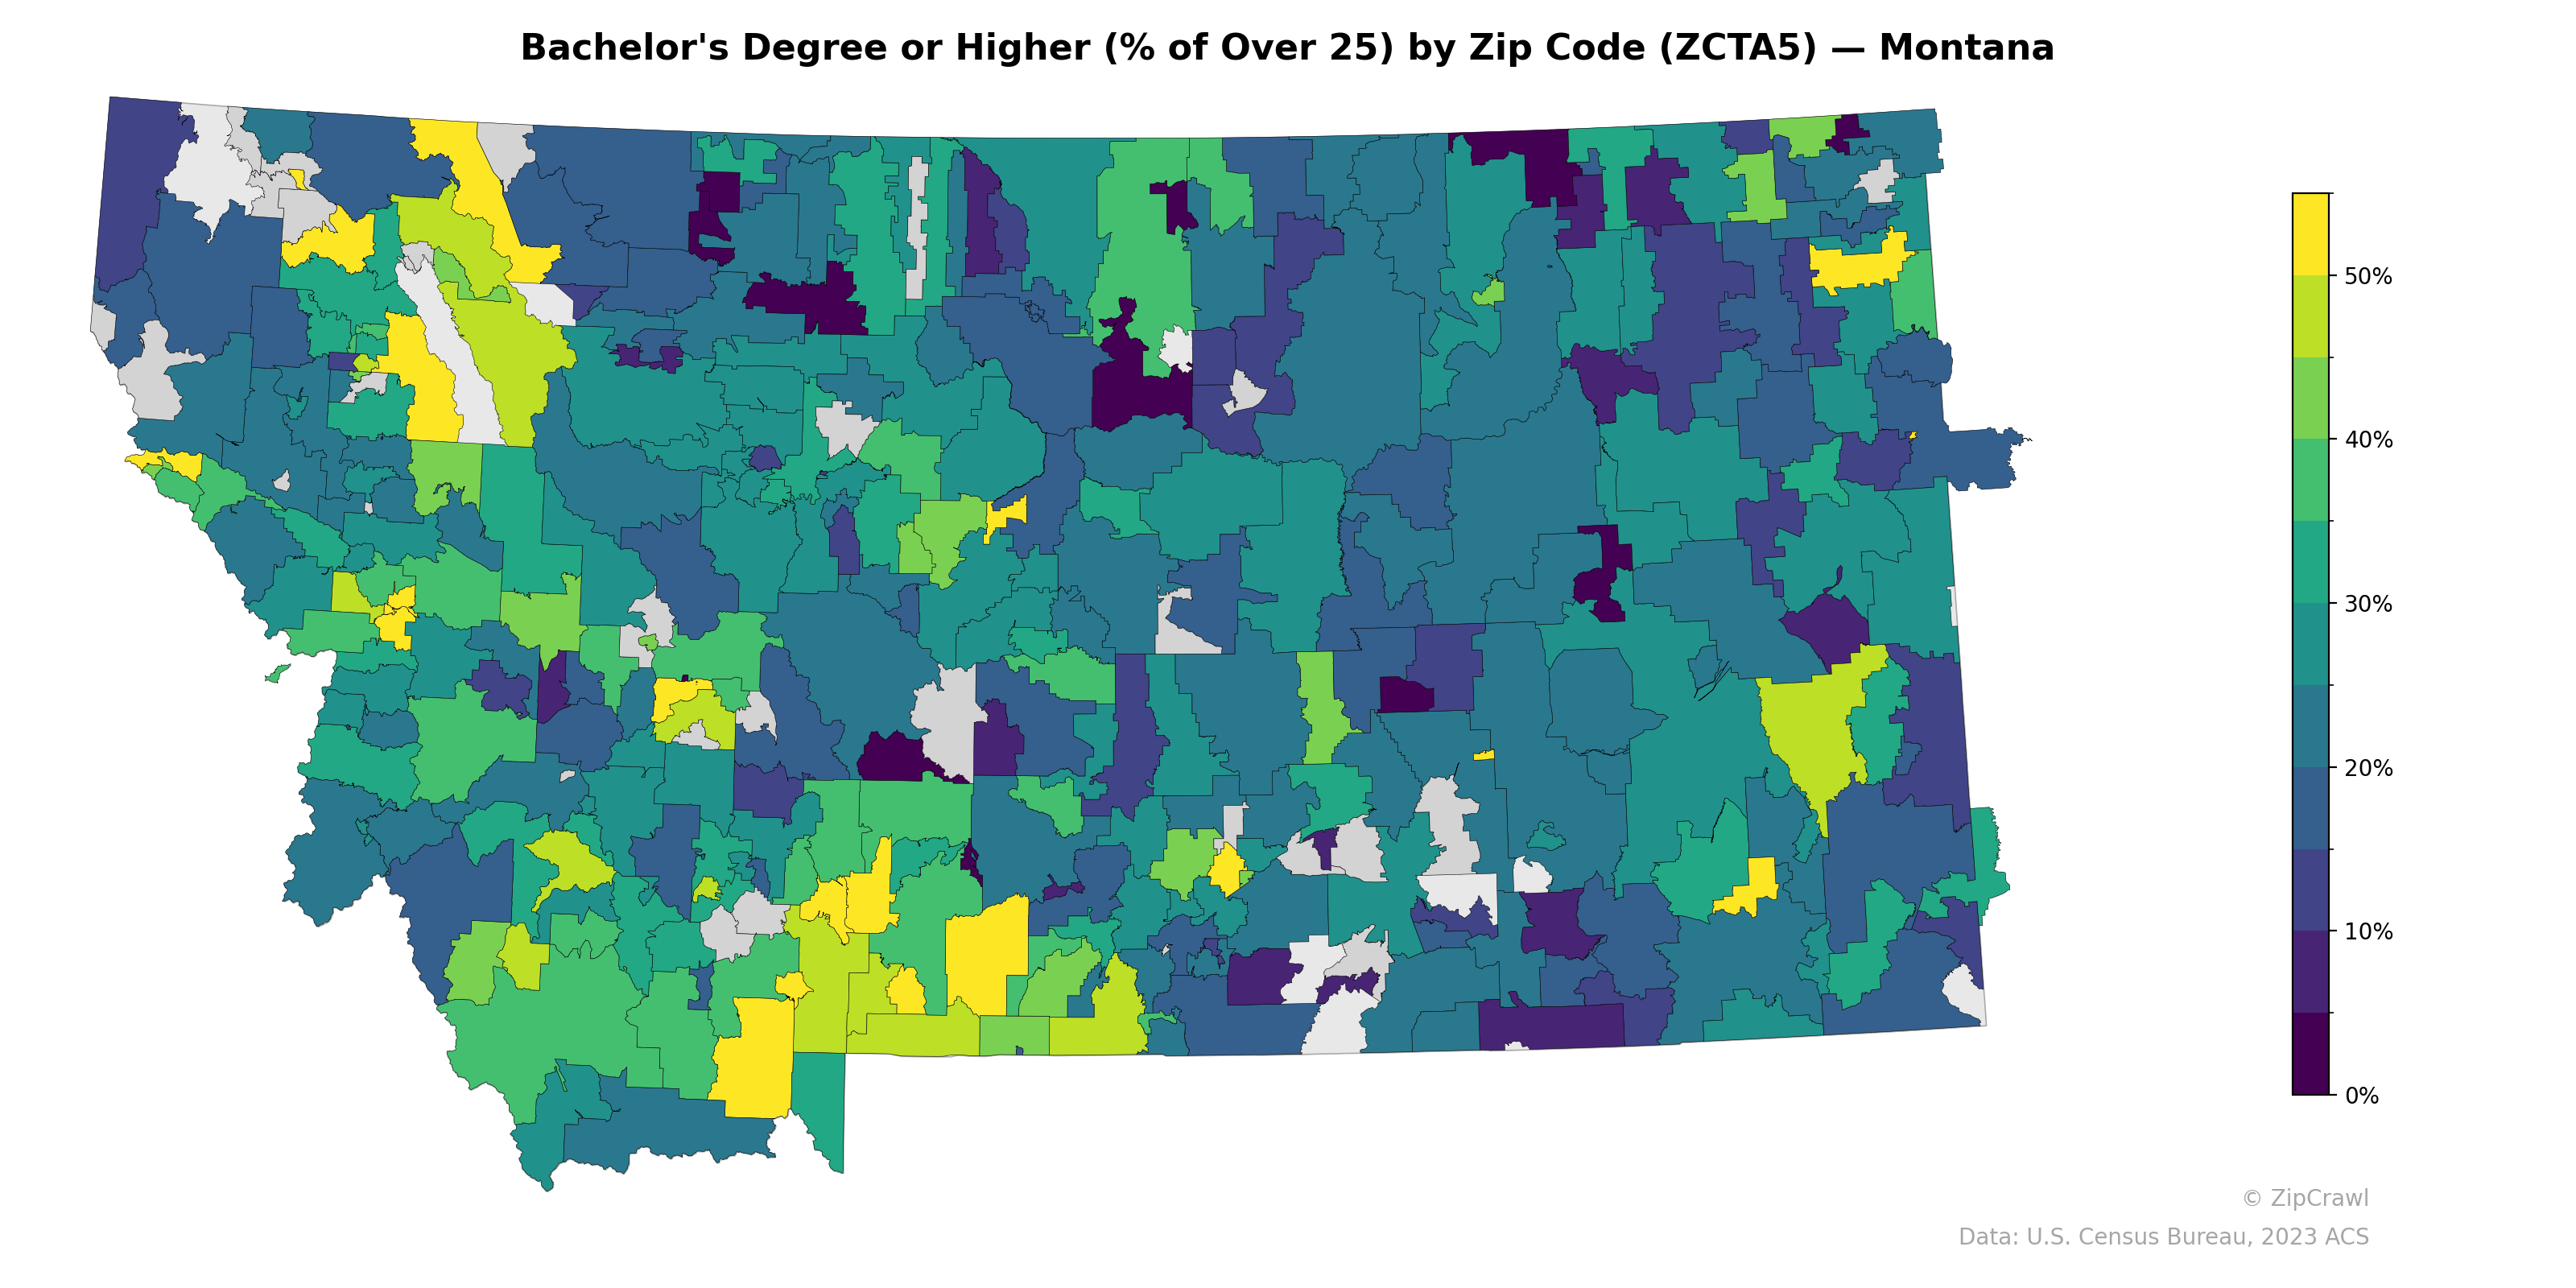
NOTE: Gray indicates insufficient data or a suppressed estimate.
Higher concentrations of bachelor's degree attainment cluster in western Montana, particularly around the Flathead Valley, Missoula, and Bozeman areas, where several zip codes exceed 40–50% of residents holding a bachelor's degree or higher. Eastern Montana and tribal reservation areas, including parts of the Fort Peck and Crow reservations, consistently display lower attainment rates below 15%, creating a stark west-to-east educational gradient. University towns such as Bozeman and Missoula stand out as bright yellow hotspots, while isolated pockets of higher education levels also appear near Billings and along the Hi-Line corridor, likely tied to regional economic centers.
Data: U.S. Census Bureau, 2023 ACS
Explore
- Population Non-Hispanic American Indian % by Zip Code (ZCTA5) — New York
- Population Non-Hispanic American Indian % by Zip Code (ZCTA5) — Montana
- Housing Owner-Occupied Median Value ($), by Zip Code (ZCTA5) — Montana
- % of Households with Broadband Internet, by Zip Code (ZCTA5) — Montana
- Household Average Size by Zip Code (ZCTA5) — Montana
- % of Population without Health Insurance, by Zip Code (ZCTA5) — Montana
- Housing % of Units Built Since 2010, by Zip Code (ZCTA5) — Montana
- Housing Owner-Occupied % of Units, by Zip Code (ZCTA5) — Montana
- Housing Median Monthly Rent ($), by Zip Code (ZCTA5) — Montana
- High School Graduate (% of Over 25) by Zip Code (ZCTA5) — Montana
- U.S. Citizens by County (% of Population Over 18)
- Population Non-Hispanic White % by Zip Code (ZCTA5) — New York
- High School Graduate (% of Over 25) by Zip Code (ZCTA5) — New York
- U.S. Citizens (% of Population Over 18) by Zip Code (ZCTA5) — Arizona
- Population Non-Hispanic Black % by Zip Code (ZCTA5) — New York
- U.S. Citizens (% of Population Over 18) by Zip Code (ZCTA5) — New York
- % of Population on Food Stamps or SNAP (Last 12 Months), by Zip Code (ZCTA5) — Florida
- Household Median Income by Zip Code (ZCTA5) — New York
- U.S. Citizens (% of Population Over 18) by Zip Code (ZCTA5) — Pennsylvania
- Population Non-Hispanic Asian % by Zip Code (ZCTA5) — Florida
- Population Hispanic % by Zip Code (ZCTA5) — New York
- Median Age by Zip Code (ZCTA5) — New York
- Housing Vacancy Rate by Zip Code (ZCTA5) — West Virginia
- % of Households with Broadband Internet, by Zip Code (ZCTA5) — West Virginia
- Population Non-Hispanic Asian % by Zip Code (ZCTA5) — West Virginia
- Population Hispanic % by Zip Code (ZCTA5) — Hawaii
- Population Non-Hispanic American Indian % by Zip Code (ZCTA5) — West Virginia
- % of Population without Health Insurance, by Zip Code (ZCTA5) — West Virginia
- High School Graduate (% of Over 25) by Zip Code (ZCTA5) — West Virginia
- % of Population on Food Stamps or SNAP (Last 12 Months), by Zip Code (ZCTA5) — West Virginia
- Bachelor's Degree or Higher (% of Over 25) by Zip Code (ZCTA5) — Vermont
- Bachelor's Degree or Higher (% of Over 25) by Zip Code (ZCTA5) — Indiana
- Bachelor's Degree or Higher (% of Over 25) by Zip Code (ZCTA5) — Maine
- Bachelor's Degree or Higher (% of Over 25) by Zip Code (ZCTA5) — Ohio
- Bachelor's Degree or Higher (% of Over 25) by Zip Code (ZCTA5) — Oregon
- Bachelor's Degree or Higher (% of Over 25) by Zip Code (ZCTA5) — Utah
- Bachelor's Degree or Higher (% of Over 25) by Zip Code (ZCTA5) — Iowa
- Bachelor's Degree or Higher (% of Over 25) by Zip Code (ZCTA5) — Louisiana
- Bachelor's Degree or Higher (% of Over 25) by Zip Code (ZCTA5) — Arizona
- Bachelor's Degree or Higher (% of Over 25) by Zip Code (ZCTA5) — Michigan