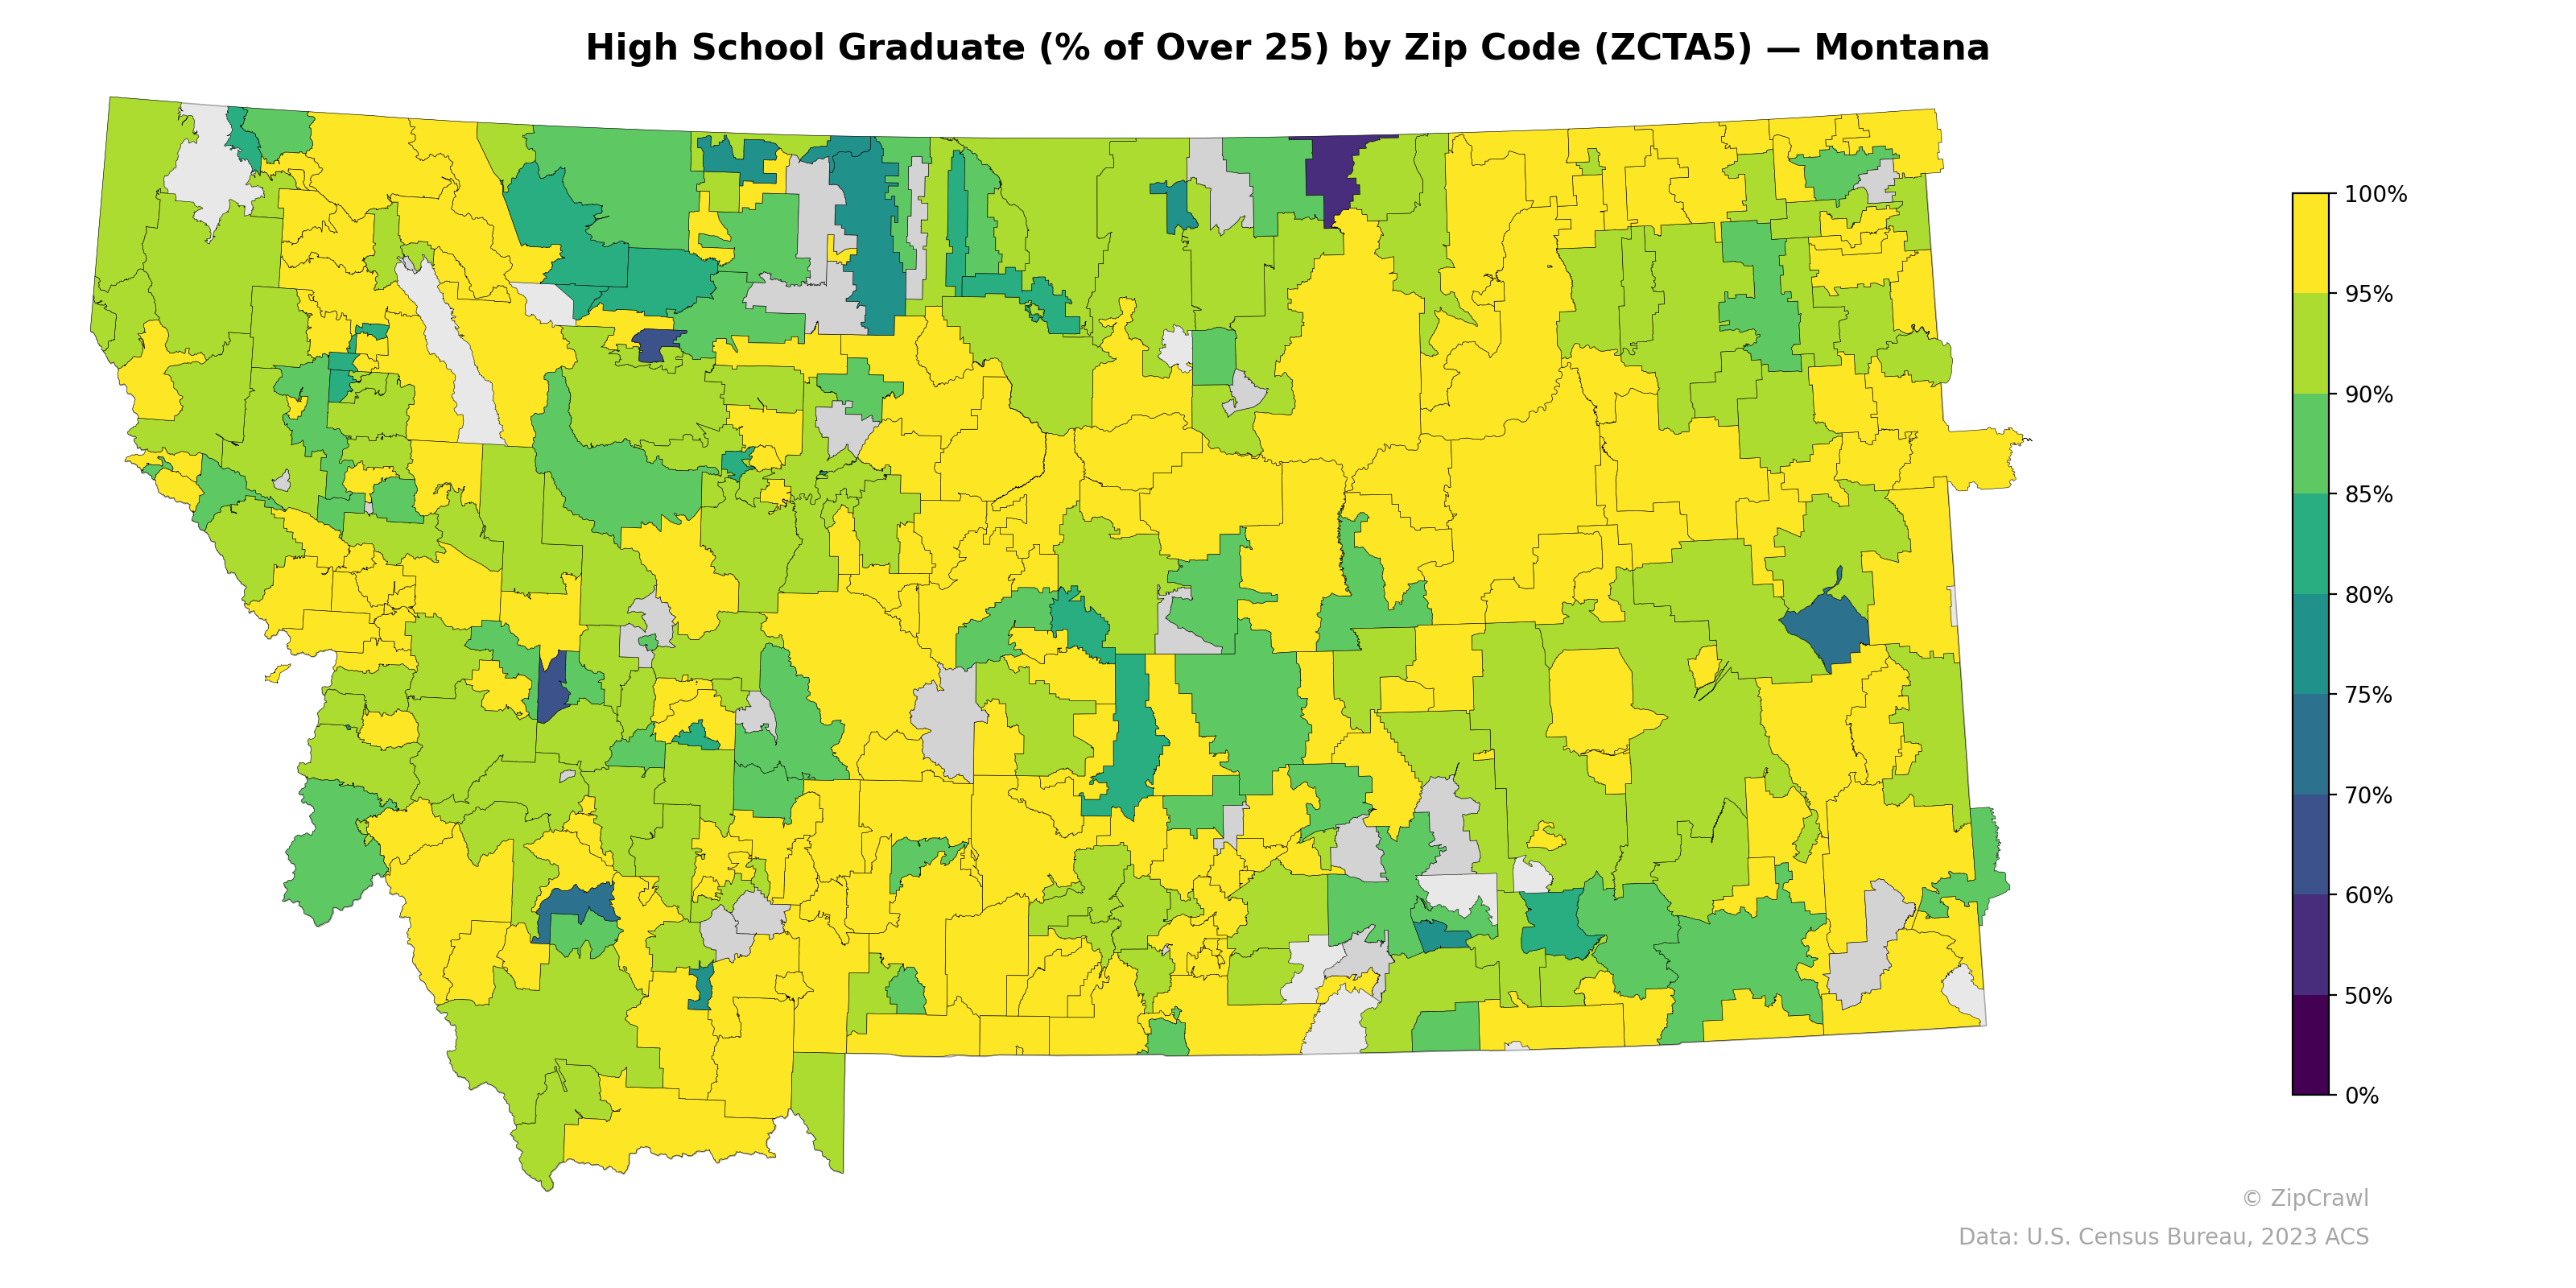
NOTE: Gray indicates insufficient data or a suppressed estimate.
High school graduation rates across Montana zip codes are generally high, with the eastern half of the state dominated by yellow shading indicating rates at or above 95%, while the western mountainous regions display considerably more variability with pockets of green and teal suggesting rates dropping into the 70–85% range. Several zip codes in the northwest near the Flathead Reservation and in south-central Montana along parts of the Crow and Northern Cheyenne reservations show notably lower attainment, with a few areas falling below 70%. The contrast between the uniformly high-attainment agricultural east and the more heterogeneous west likely reflects differences in demographic composition, economic structure, and the presence of tribal communities where historical educational inequities persist.
Data: U.S. Census Bureau, 2023 ACS
Explore
- Population Non-Hispanic American Indian % by Zip Code (ZCTA5) — New York
- Household Average Size by Zip Code (ZCTA5) — Montana
- Housing Owner-Occupied Median Value ($), by Zip Code (ZCTA5) — Montana
- % of Population without Health Insurance, by Zip Code (ZCTA5) — Montana
- Population Non-Hispanic American Indian % by Zip Code (ZCTA5) — Montana
- Housing % of Units Built Since 2010, by Zip Code (ZCTA5) — Montana
- Housing Median Monthly Rent ($), by Zip Code (ZCTA5) — Montana
- Housing Owner-Occupied % of Units, by Zip Code (ZCTA5) — Montana
- Bachelor's Degree or Higher (% of Over 25) by Zip Code (ZCTA5) — Montana
- % of Households with Broadband Internet, by Zip Code (ZCTA5) — Montana
- U.S. Citizens by County (% of Population Over 18)
- % of Population on Food Stamps or SNAP (Last 12 Months), by Zip Code (ZCTA5) — Illinois
- % of Population on Food Stamps or SNAP (Last 12 Months), by Zip Code (ZCTA5) — Washington
- Household Median Income by Zip Code (ZCTA5) — New York
- Median Age by Zip Code (ZCTA5) — New York
- U.S. Citizens (% of Population Over 18) by Zip Code (ZCTA5) — New York
- Population Non-Hispanic White % by Zip Code (ZCTA5) — New York
- Population Hispanic % by Zip Code (ZCTA5) — New York
- Population Non-Hispanic Asian % by Zip Code (ZCTA5) — Florida
- % of Population on Food Stamps or SNAP (Last 12 Months), by Zip Code (ZCTA5) — Florida
- Population Non-Hispanic Black % by Zip Code (ZCTA5) — New York
- Population Non-Hispanic Asian % by Zip Code (ZCTA5) — West Virginia
- % of Population without Health Insurance, by Zip Code (ZCTA5) — West Virginia
- % of Population on Food Stamps or SNAP (Last 12 Months), by Zip Code (ZCTA5) — West Virginia
- Population Hispanic % by Zip Code (ZCTA5) — Hawaii
- Housing Owner-Occupied % of Units, by Zip Code (ZCTA5) — West Virginia
- Bachelor's Degree or Higher (% of Over 25) by Zip Code (ZCTA5) — West Virginia
- Population Non-Hispanic American Indian % by Zip Code (ZCTA5) — West Virginia
- % of Households with Broadband Internet, by Zip Code (ZCTA5) — West Virginia
- Housing Vacancy Rate by Zip Code (ZCTA5) — West Virginia
- High School Graduate (% of Over 25) by Zip Code (ZCTA5) — Vermont
- High School Graduate (% of Over 25) by Zip Code (ZCTA5) — Indiana
- High School Graduate (% of Over 25) by Zip Code (ZCTA5) — Maine
- High School Graduate (% of Over 25) by Zip Code (ZCTA5) — Ohio
- High School Graduate (% of Over 25) by Zip Code (ZCTA5) — Utah
- High School Graduate (% of Over 25) by Zip Code (ZCTA5) — Iowa
- High School Graduate (% of Over 25) by Zip Code (ZCTA5) — Louisiana
- High School Graduate (% of Over 25) by Zip Code (ZCTA5) — Michigan
- High School Graduate (% of Over 25) by Zip Code (ZCTA5) — Arizona
- High School Graduate (% of Over 25) by Zip Code (ZCTA5) — Colorado