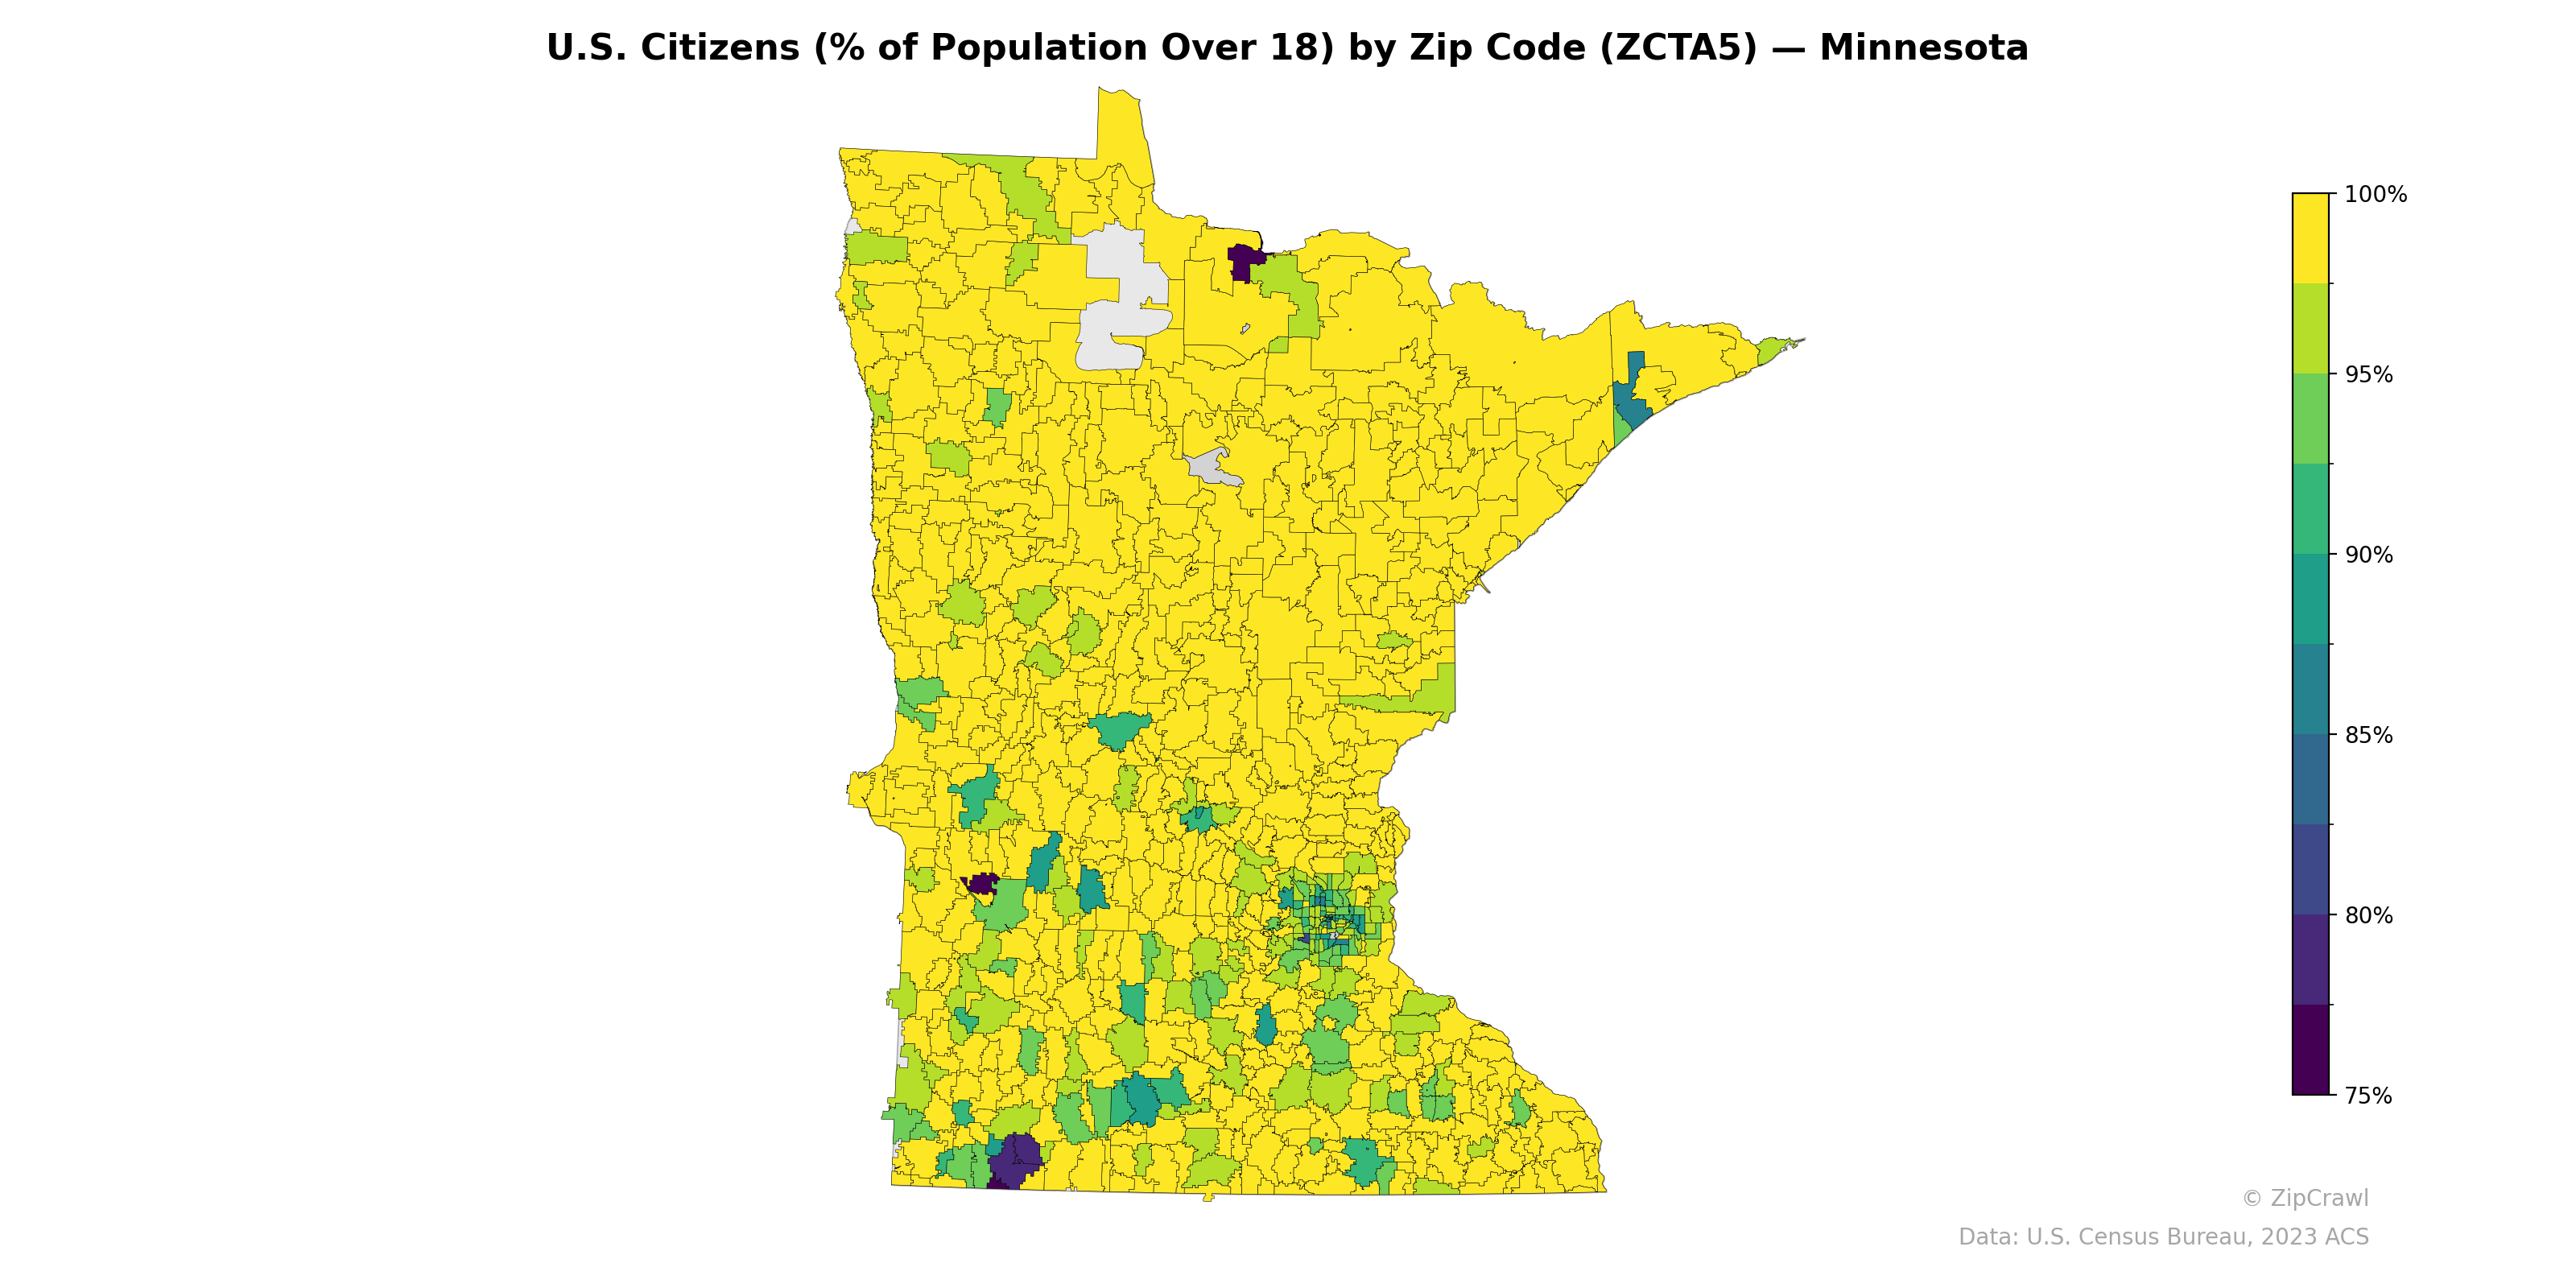
NOTE: Gray indicates insufficient data or a suppressed estimate.
The vast majority of Minnesota zip codes report U.S. citizenship rates above 95% among adults, with near-universal citizenship prevalent across the rural northern and western portions of the state. Notable concentrations of lower citizenship rates—dropping to 75% or below—cluster in the Twin Cities metropolitan area, particularly in Minneapolis zip codes, as well as in scattered pockets in southern Minnesota near Worthington and Marshall, likely reflecting immigrant and refugee communities in meatpacking regions. A few isolated zip codes in the northwest near Moorhead and the northeastern tip near the Canadian border also show moderately lower rates in the 85–90% range, contrasting sharply with surrounding areas at or near 100%.
Data: U.S. Census Bureau, 2023 ACS
Explore
- % of Households with Broadband Internet, by Zip Code (ZCTA5) — Texas
- Household Median Income by Zip Code (ZCTA5) — Minnesota
- Median Age by Zip Code (ZCTA5) — Minnesota
- Population Non-Hispanic White % by Zip Code (ZCTA5) — Minnesota
- Population Non-Hispanic Asian % by Zip Code (ZCTA5) — Colorado
- % of Population on Food Stamps or SNAP (Last 12 Months), by Zip Code (ZCTA5) — Colorado
- Population Hispanic % by Zip Code (ZCTA5) — Minnesota
- Population Non-Hispanic Black % by Zip Code (ZCTA5) — Minnesota
- Married Couple (% of all Households) by Zip Code (ZCTA5) — Colorado
- Housing Vacancy Rate by Zip Code (ZCTA5) — Colorado
- Bachelor's Degree or Higher (% of Over 25) by County
- Bachelor's Degree or Higher (% of Over 25) by Zip Code (ZCTA5) — Texas
- Housing % of Units Built Since 2010, by Zip Code (ZCTA5) — Texas
- Married Couple (% of all Households) by Zip Code (ZCTA5) — Texas
- Housing Owner-Occupied % of Units, by Zip Code (ZCTA5) — Texas
- % of Population without Health Insurance, by Zip Code (ZCTA5) — Texas
- Housing Owner-Occupied Median Value ($), by Zip Code (ZCTA5) — Texas
- Housing Median Monthly Rent ($), by Zip Code (ZCTA5) — Texas
- Housing Vacancy Rate by Zip Code (ZCTA5) — Texas
- Household Average Size by Zip Code (ZCTA5) — Texas
- % of Households with Broadband Internet, by Zip Code (ZCTA5) — Wisconsin
- High School Graduate (% of Over 25) by Zip Code (ZCTA5) — Wisconsin
- Population Non-Hispanic American Indian % by Zip Code (ZCTA5) — Wisconsin
- Population Non-Hispanic Black % by Zip Code (ZCTA5) — Wisconsin
- % of Population on Food Stamps or SNAP (Last 12 Months), by Zip Code (ZCTA5) — Wisconsin
- Bachelor's Degree or Higher (% of Over 25) by Zip Code (ZCTA5) — Wisconsin
- Population Non-Hispanic White % by Zip Code (ZCTA5) — Wisconsin
- Median Age by Zip Code (ZCTA5) — Wisconsin
- Married Couple (% of all Households) by Zip Code (ZCTA5) — Wisconsin
- Population Hispanic % by Zip Code (ZCTA5) — Wisconsin
- U.S. Citizens (% of Population Over 18) by Zip Code (ZCTA5) — Maine
- U.S. Citizens (% of Population Over 18) by Zip Code (ZCTA5) — Ohio
- U.S. Citizens (% of Population Over 18) by Zip Code (ZCTA5) — Utah
- U.S. Citizens (% of Population Over 18) by Zip Code (ZCTA5) — Michigan
- U.S. Citizens (% of Population Over 18) by Zip Code (ZCTA5) — Missouri
- U.S. Citizens (% of Population Over 18) by Zip Code (ZCTA5) — Oregon
- U.S. Citizens (% of Population Over 18) by Zip Code (ZCTA5) — Iowa
- U.S. Citizens (% of Population Over 18) by Zip Code (ZCTA5) — Mississippi
- U.S. Citizens (% of Population Over 18) by Zip Code (ZCTA5) — Tennessee
- U.S. Citizens (% of Population Over 18) by Zip Code (ZCTA5) — Minneapolis Metro