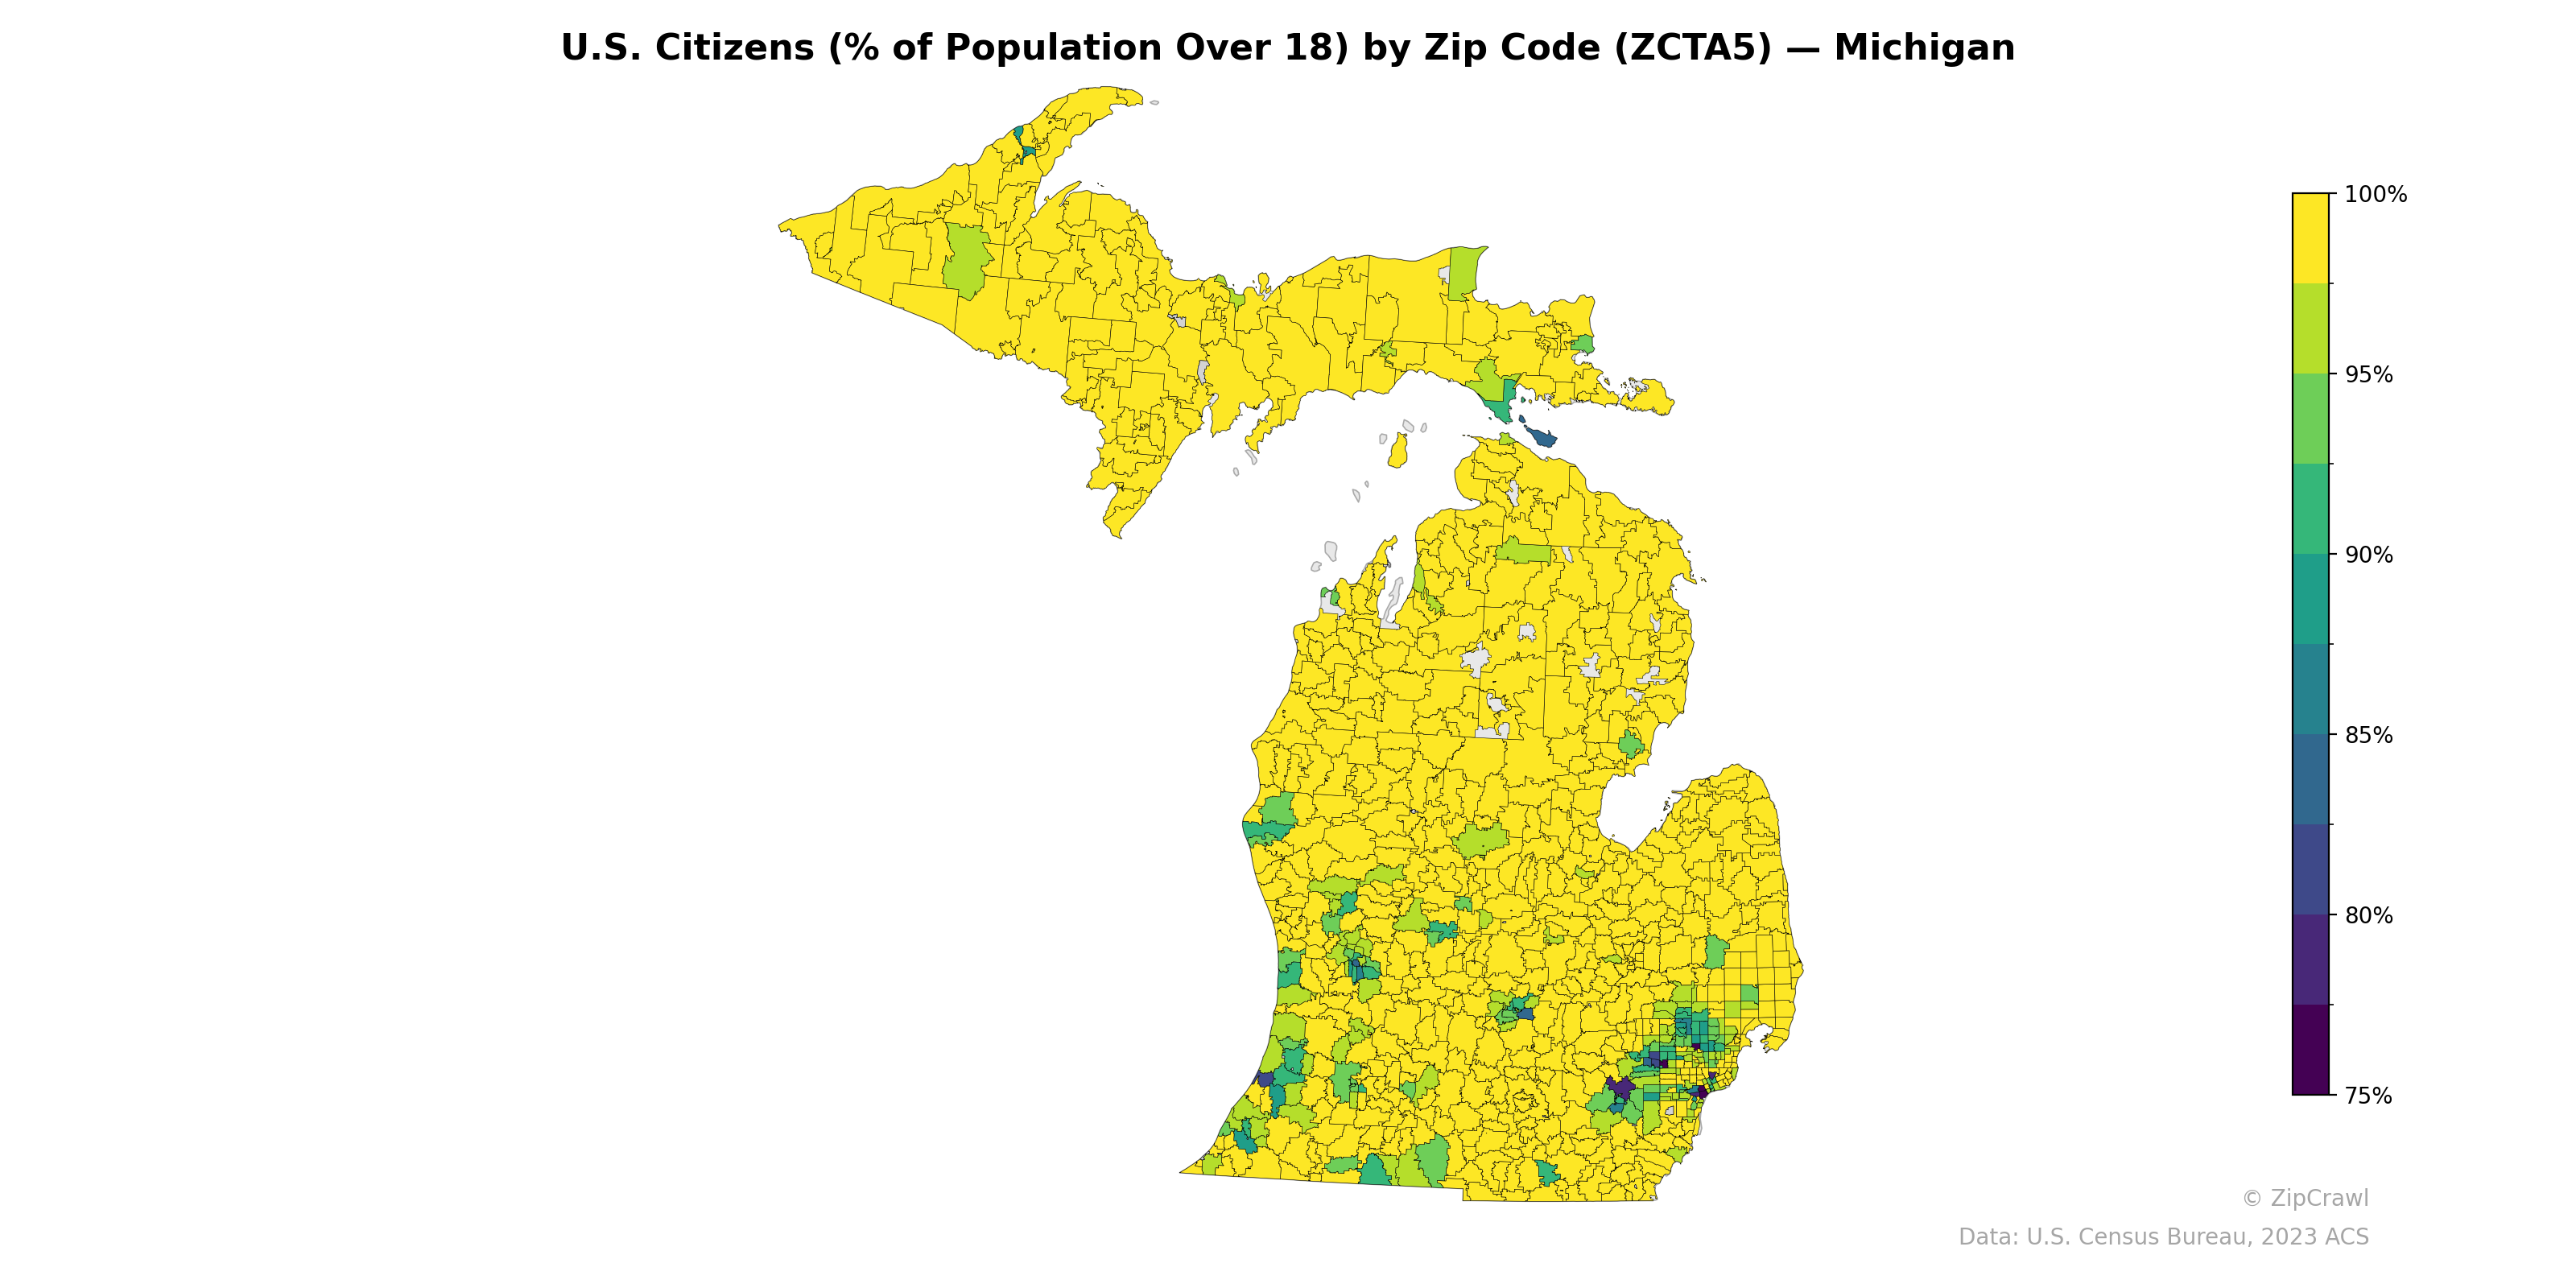
NOTE: Gray indicates insufficient data or a suppressed estimate.
The vast majority of Michigan zip codes report U.S. citizenship rates above 95% among the adult population, with near-universal citizenship across the Upper Peninsula and much of the northern Lower Peninsula. A notable concentration of lower citizenship rates—dropping to 75% or below—clusters in the southeastern corner of the state, particularly in the Detroit-Dearborn metropolitan area, where several zip codes display deep purple shading indicative of substantial non-citizen adult populations. Scattered pockets of moderately lower citizenship rates (85–90%) also appear in west-central Lower Michigan, likely corresponding to agricultural communities in the Grand Rapids and Holland areas with established immigrant populations.
Data: U.S. Census Bureau, 2023 ACS
Explore
- % of Population without Health Insurance, by Zip Code (ZCTA5) — New York Metro
- High School Graduate (% of Over 25) by Zip Code (ZCTA5) — Michigan
- Population Non-Hispanic White % by Zip Code (ZCTA5) — Michigan
- Population Non-Hispanic Asian % by Zip Code (ZCTA5) — North Carolina
- Household Median Income by Zip Code (ZCTA5) — Michigan
- Population Non-Hispanic Black % by Zip Code (ZCTA5) — Michigan
- % of Population on Food Stamps or SNAP (Last 12 Months), by Zip Code (ZCTA5) — North Carolina
- Population Non-Hispanic American Indian % by Zip Code (ZCTA5) — Michigan
- Population Hispanic % by Zip Code (ZCTA5) — Michigan
- Median Age by Zip Code (ZCTA5) — Michigan
- Bachelor's Degree or Higher (% of Over 25) by Zip Code (ZCTA5) — Kansas
- Population Non-Hispanic White % by County
- Population Non-Hispanic Asian % by Zip Code (ZCTA5) — New York Metro
- Married Couple (% of all Households) by Zip Code (ZCTA5) — New York Metro
- Housing % of Units Built Since 2010, by Zip Code (ZCTA5) — New York Metro
- Housing Median Monthly Rent ($), by Zip Code (ZCTA5) — New York Metro
- Household Median Income by Zip Code (ZCTA5) — New York Metro
- Housing Vacancy Rate by Zip Code (ZCTA5) — New York Metro
- % of Households with Broadband Internet, by Zip Code (ZCTA5) — New York Metro
- Housing Owner-Occupied Median Value ($), by Zip Code (ZCTA5) — New York Metro
- Household Average Size by Zip Code (ZCTA5) — New York Metro
- Married Couple (% of all Households) by Zip Code (ZCTA5) — North Carolina
- Housing % of Units Built Since 2010, by Zip Code (ZCTA5) — North Carolina
- Housing Vacancy Rate by Zip Code (ZCTA5) — North Carolina
- % of Households with Broadband Internet, by Zip Code (ZCTA5) — North Carolina
- Bachelor's Degree or Higher (% of Over 25) by Zip Code (ZCTA5) — North Carolina
- Housing Owner-Occupied Median Value ($), by Zip Code (ZCTA5) — North Carolina
- Housing Median Monthly Rent ($), by Zip Code (ZCTA5) — North Carolina
- Household Average Size by Zip Code (ZCTA5) — North Carolina
- % of Population without Health Insurance, by Zip Code (ZCTA5) — North Carolina
- U.S. Citizens (% of Population Over 18) by Zip Code (ZCTA5) — Maine
- U.S. Citizens (% of Population Over 18) by Zip Code (ZCTA5) — Utah
- U.S. Citizens (% of Population Over 18) by Zip Code (ZCTA5) — Ohio
- U.S. Citizens (% of Population Over 18) by Zip Code (ZCTA5) — Missouri
- U.S. Citizens (% of Population Over 18) by Zip Code (ZCTA5) — Oregon
- U.S. Citizens (% of Population Over 18) by Zip Code (ZCTA5) — Iowa
- U.S. Citizens (% of Population Over 18) by Zip Code (ZCTA5) — Minnesota
- U.S. Citizens (% of Population Over 18) by Zip Code (ZCTA5) — Mississippi
- U.S. Citizens (% of Population Over 18) by Zip Code (ZCTA5) — Montana
- U.S. Citizens (% of Population Over 18) by Zip Code (ZCTA5) — Texas