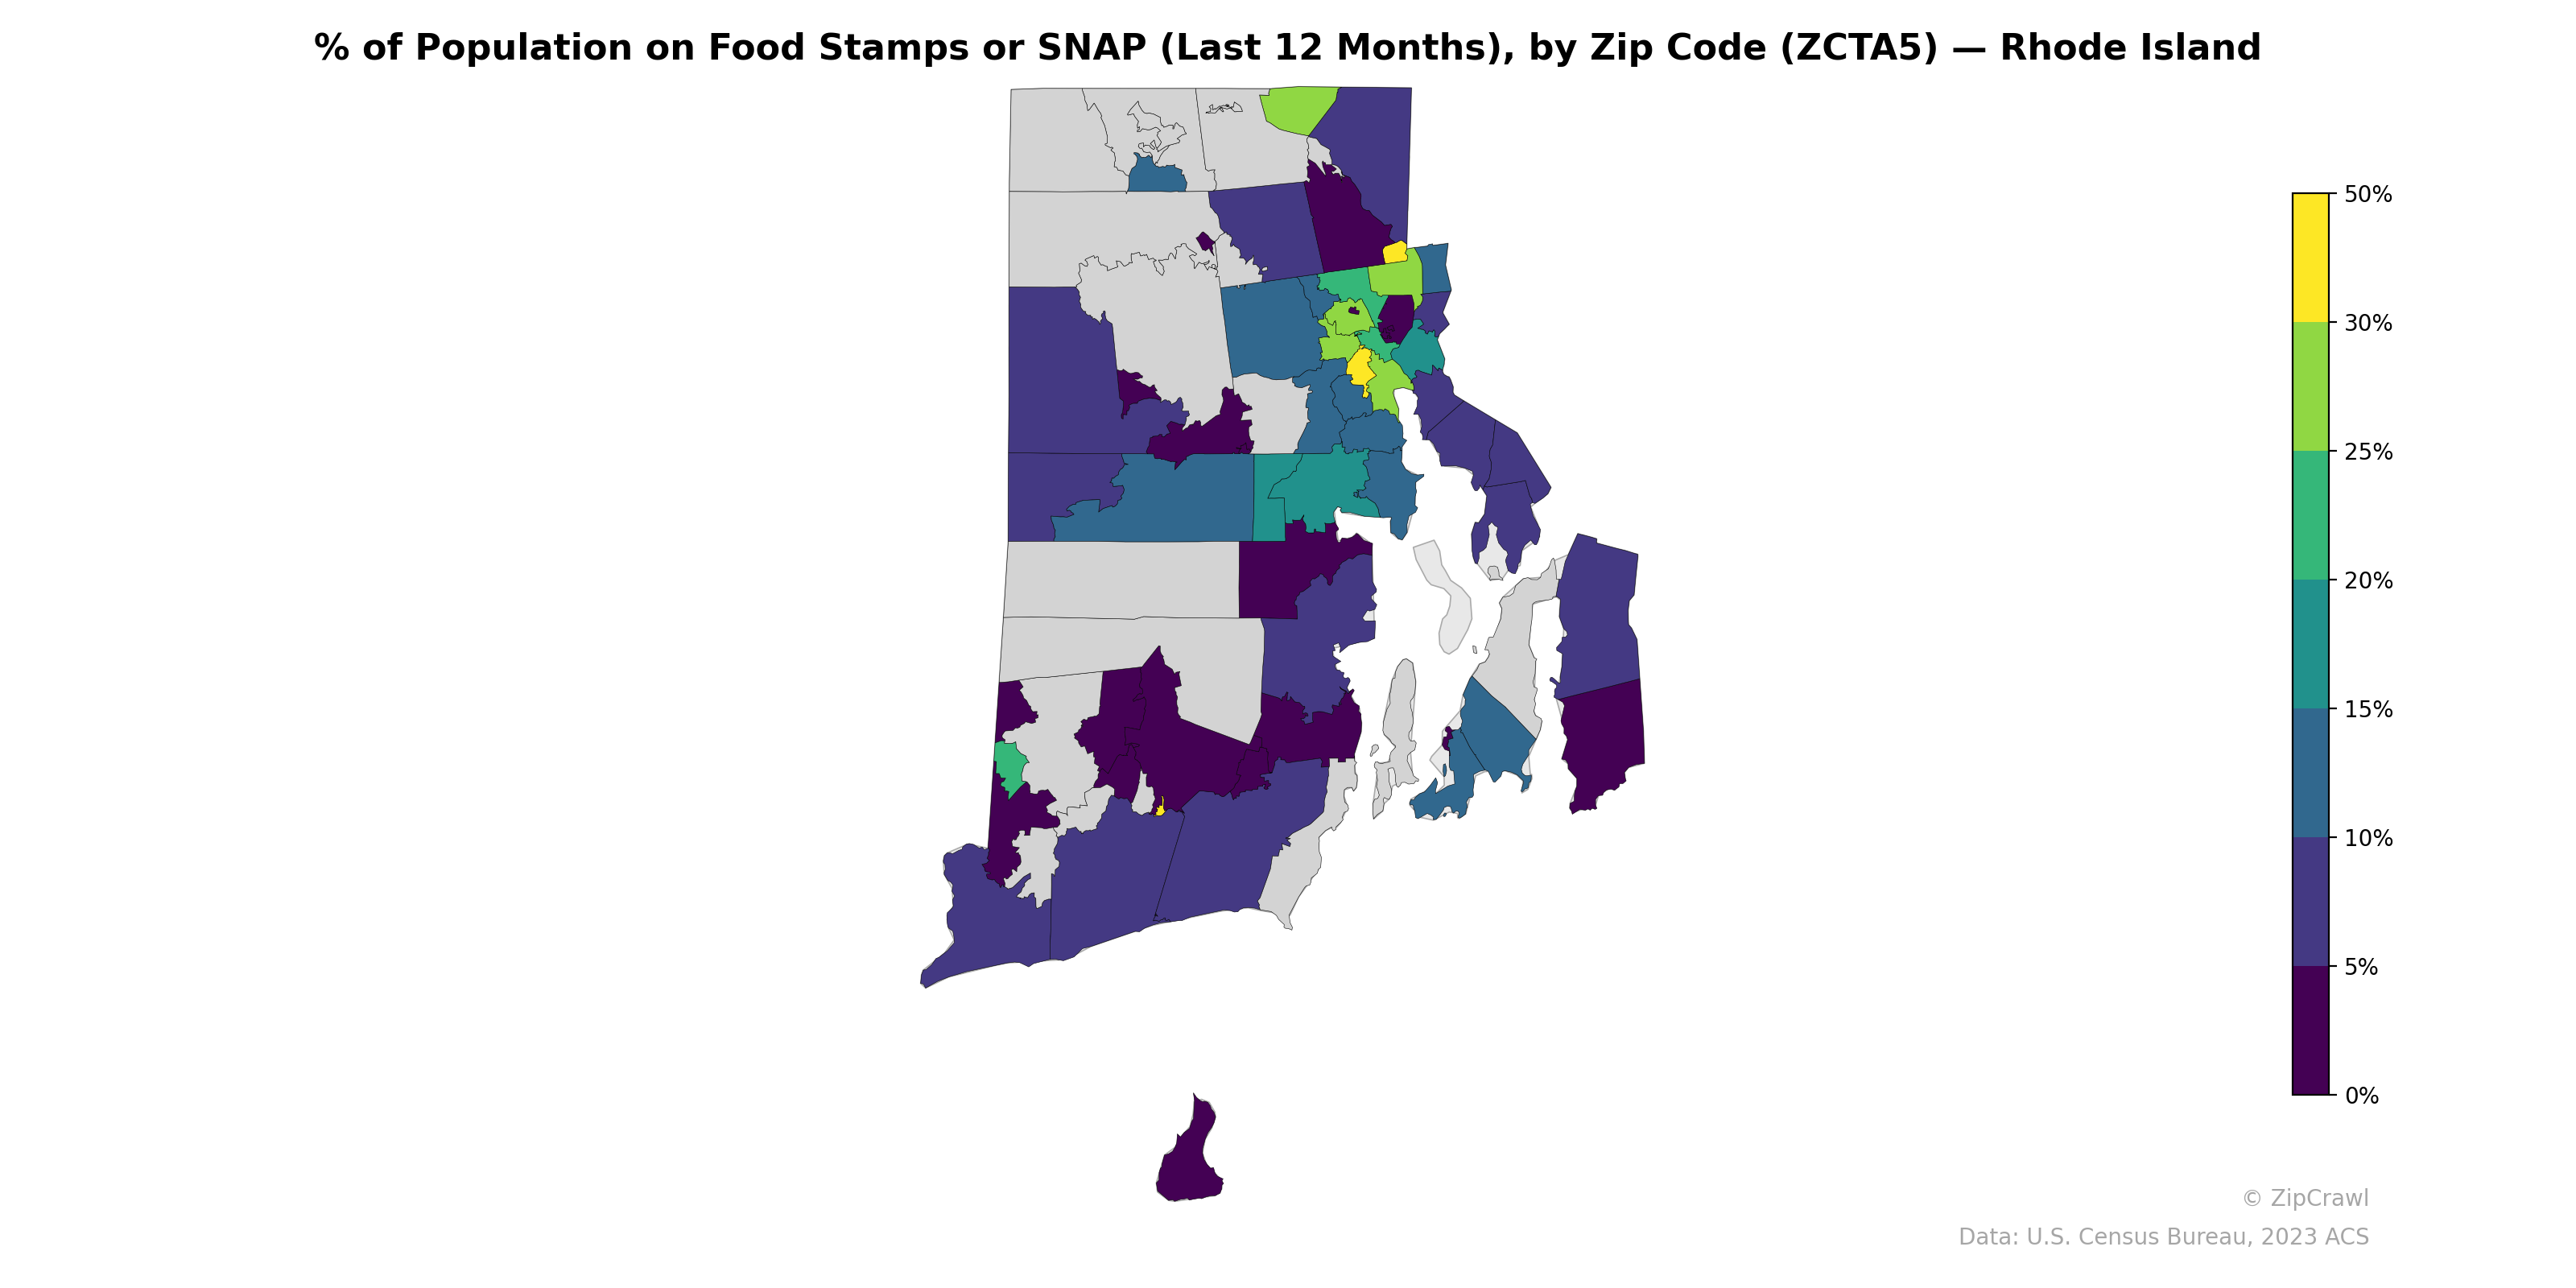
NOTE: Gray indicates insufficient data or a suppressed estimate.
Urban zip codes in and around Providence display the highest SNAP participation rates, with several areas reaching 30–50%, forming a pronounced cluster in the northeastern quadrant of the state. In contrast, the suburban and rural zip codes in the western and southern coastal regions consistently fall below 10%, with some areas near 0%. This sharp urban-rural gradient underscores concentrated economic need in Rhode Island's core metro area relative to the more affluent communities in South County, the East Bay, and the western border towns.
Data: U.S. Census Bureau, 2023 ACS
Explore
- % of Households with Broadband Internet, by Zip Code (ZCTA5) — New York
- Housing Vacancy Rate by Zip Code (ZCTA5) — Rhode Island
- Population Hispanic % by Zip Code (ZCTA5) — Delaware
- Population Non-Hispanic Asian % by Zip Code (ZCTA5) — Rhode Island
- Population Non-Hispanic Black % by Zip Code (ZCTA5) — Delaware
- Household Median Income by Zip Code (ZCTA5) — Delaware
- Median Age by Zip Code (ZCTA5) — Delaware
- Married Couple (% of all Households) by Zip Code (ZCTA5) — Rhode Island
- Population Non-Hispanic White % by Zip Code (ZCTA5) — Delaware
- U.S. Citizens (% of Population Over 18) by Zip Code (ZCTA5) — Delaware
- Housing Median Monthly Rent ($), by County
- Household Average Size by County
- Housing Owner-Occupied % of Units, by Zip Code (ZCTA5) — California
- Housing Owner-Occupied % of Units, by Zip Code (ZCTA5) — Tennessee
- Household Average Size by Zip Code (ZCTA5) — New York
- Married Couple (% of all Households) by Zip Code (ZCTA5) — New York
- Housing Owner-Occupied Median Value ($), by Zip Code (ZCTA5) — New York
- % of Population without Health Insurance, by Zip Code (ZCTA5) — New York
- Housing Median Monthly Rent ($), by Zip Code (ZCTA5) — New York
- Housing Vacancy Rate by Zip Code (ZCTA5) — New York
- Bachelor's Degree or Higher (% of Over 25) by Zip Code (ZCTA5) — New York
- Housing Owner-Occupied % of Units, by Zip Code (ZCTA5) — New York
- Housing % of Units Built Since 2010, by Zip Code (ZCTA5) — New York
- Population Non-Hispanic American Indian % by Zip Code (ZCTA5) — Rhode Island
- Population Non-Hispanic American Indian % by Zip Code (ZCTA5) — North Dakota
- High School Graduate (% of Over 25) by Zip Code (ZCTA5) — Rhode Island
- Household Average Size by Zip Code (ZCTA5) — Rhode Island
- Population Non-Hispanic Black % by Zip Code (ZCTA5) — North Dakota
- Housing Vacancy Rate by Zip Code (ZCTA5) — Alaska
- Bachelor's Degree or Higher (% of Over 25) by Zip Code (ZCTA5) — Rhode Island
- % of Population on Food Stamps or SNAP (Last 12 Months), by Zip Code (ZCTA5) — Maryland
- % of Population on Food Stamps or SNAP (Last 12 Months), by Zip Code (ZCTA5) — Iowa
- % of Population on Food Stamps or SNAP (Last 12 Months), by Zip Code (ZCTA5) — Idaho
- % of Population on Food Stamps or SNAP (Last 12 Months), by Zip Code (ZCTA5) — Ohio
- % of Population on Food Stamps or SNAP (Last 12 Months), by Zip Code (ZCTA5) — Oregon
- % of Population on Food Stamps or SNAP (Last 12 Months), by Zip Code (ZCTA5) — Montana
- % of Population on Food Stamps or SNAP (Last 12 Months), by Zip Code (ZCTA5) — Utah
- % of Population on Food Stamps or SNAP (Last 12 Months), by Zip Code (ZCTA5) — Maine
- % of Population on Food Stamps or SNAP (Last 12 Months), by Zip Code (ZCTA5) — Portland Metro
- % of Population on Food Stamps or SNAP (Last 12 Months), by Zip Code (ZCTA5) — Indiana