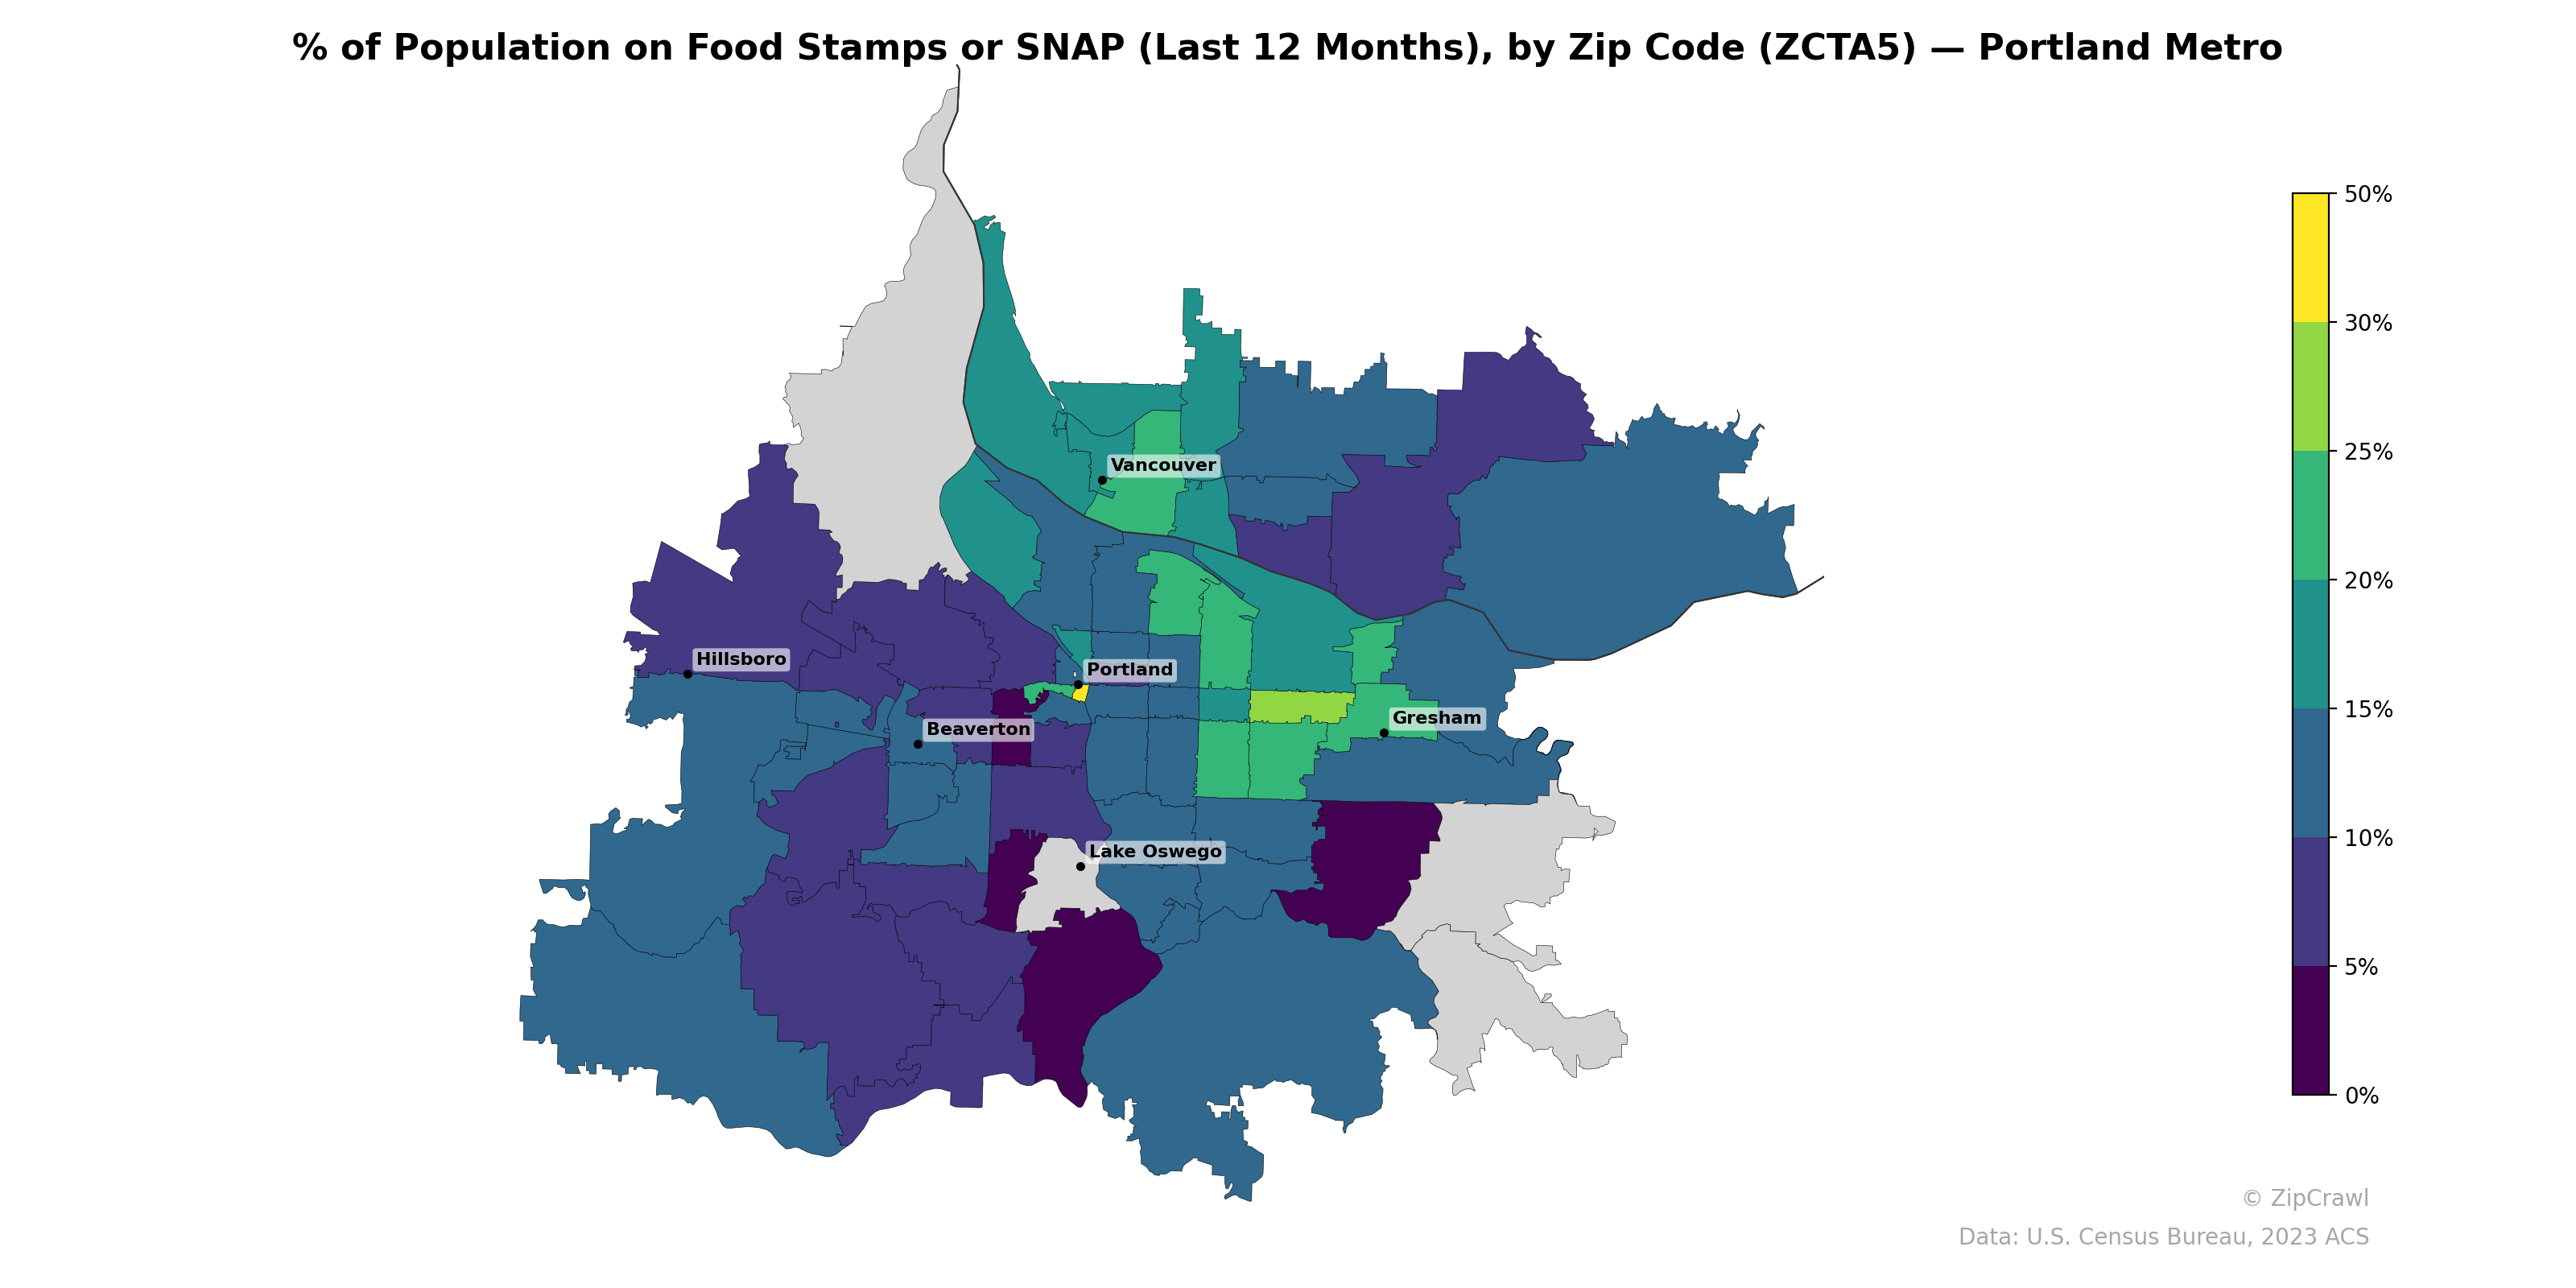
NOTE: Gray indicates insufficient data or a suppressed estimate.
The highest SNAP participation rates, reaching 25–35% or above, concentrate in inner North and Northeast Portland zip codes as well as pockets near Gresham, while adjacent areas to the west—particularly Lake Oswego, West Linn, and parts of Beaverton—register among the lowest rates at under 5%. A clear east-west gradient is evident, with zip codes east of the Willamette River generally displaying elevated food assistance usage compared to western suburbs like Hillsboro and the Tualatin Valley. Vancouver's zip codes on the Washington side show moderate participation in the 10–20% range, forming a middle tier between Portland's high-need urban core and the more affluent southwestern suburbs.
Data: U.S. Census Bureau, 2023 ACS
Explore
- Bachelor's Degree or Higher (% of Over 25) by Zip Code (ZCTA5) — Texas
- Bachelor's Degree or Higher (% of Over 25) by Zip Code (ZCTA5) — Colorado
- Housing Owner-Occupied % of Units, by Zip Code (ZCTA5) — Colorado
- % of Households with Broadband Internet, by Zip Code (ZCTA5) — Colorado
- Population Non-Hispanic Asian % by Zip Code (ZCTA5) — Portland Metro
- Household Average Size by Zip Code (ZCTA5) — Colorado
- % of Population without Health Insurance, by Zip Code (ZCTA5) — Colorado
- Housing Owner-Occupied Median Value ($), by Zip Code (ZCTA5) — Colorado
- Housing Median Monthly Rent ($), by Zip Code (ZCTA5) — Colorado
- Housing % of Units Built Since 2010, by Zip Code (ZCTA5) — Colorado
- Bachelor's Degree or Higher (% of Over 25) by County
- % of Population without Health Insurance, by Zip Code (ZCTA5) — Texas
- Housing % of Units Built Since 2010, by Zip Code (ZCTA5) — Texas
- Housing Owner-Occupied Median Value ($), by Zip Code (ZCTA5) — Texas
- Household Average Size by Zip Code (ZCTA5) — Texas
- Housing Owner-Occupied % of Units, by Zip Code (ZCTA5) — Texas
- Housing Median Monthly Rent ($), by Zip Code (ZCTA5) — Texas
- Married Couple (% of all Households) by Zip Code (ZCTA5) — Texas
- % of Households with Broadband Internet, by Zip Code (ZCTA5) — Texas
- Housing Vacancy Rate by Zip Code (ZCTA5) — Texas
- Bachelor's Degree or Higher (% of Over 25) by Zip Code (ZCTA5) — Wisconsin
- High School Graduate (% of Over 25) by Zip Code (ZCTA5) — Wisconsin
- Population Non-Hispanic Black % by Zip Code (ZCTA5) — Wisconsin
- Population Non-Hispanic White % by Zip Code (ZCTA5) — Wisconsin
- U.S. Citizens (% of Population Over 18) by Zip Code (ZCTA5) — Colorado
- Population Non-Hispanic American Indian % by Zip Code (ZCTA5) — Wisconsin
- Household Average Size by Zip Code (ZCTA5) — Wisconsin
- Median Age by Zip Code (ZCTA5) — Wisconsin
- Married Couple (% of all Households) by Zip Code (ZCTA5) — Wisconsin
- Population Hispanic % by Zip Code (ZCTA5) — Wisconsin
- % of Population on Food Stamps or SNAP (Last 12 Months), by Zip Code (ZCTA5) — Orlando Metro
- % of Population on Food Stamps or SNAP (Last 12 Months), by Zip Code (ZCTA5) — Atlanta Metro
- % of Population on Food Stamps or SNAP (Last 12 Months), by Zip Code (ZCTA5) — Tampa Metro
- % of Population on Food Stamps or SNAP (Last 12 Months), by Zip Code (ZCTA5) — Miami Metro
- % of Population on Food Stamps or SNAP (Last 12 Months), by Zip Code (ZCTA5) — St. Louis Metro
- % of Population on Food Stamps or SNAP (Last 12 Months), by Zip Code (ZCTA5) — Boston Metro
- % of Population on Food Stamps or SNAP (Last 12 Months), by Zip Code (ZCTA5) — Dallas Metro
- % of Population on Food Stamps or SNAP (Last 12 Months), by Zip Code (ZCTA5) — Detroit Metro
- % of Population on Food Stamps or SNAP (Last 12 Months), by Zip Code (ZCTA5) — Houston Metro
- % of Population on Food Stamps or SNAP (Last 12 Months), by Zip Code (ZCTA5) — Chicago Metro