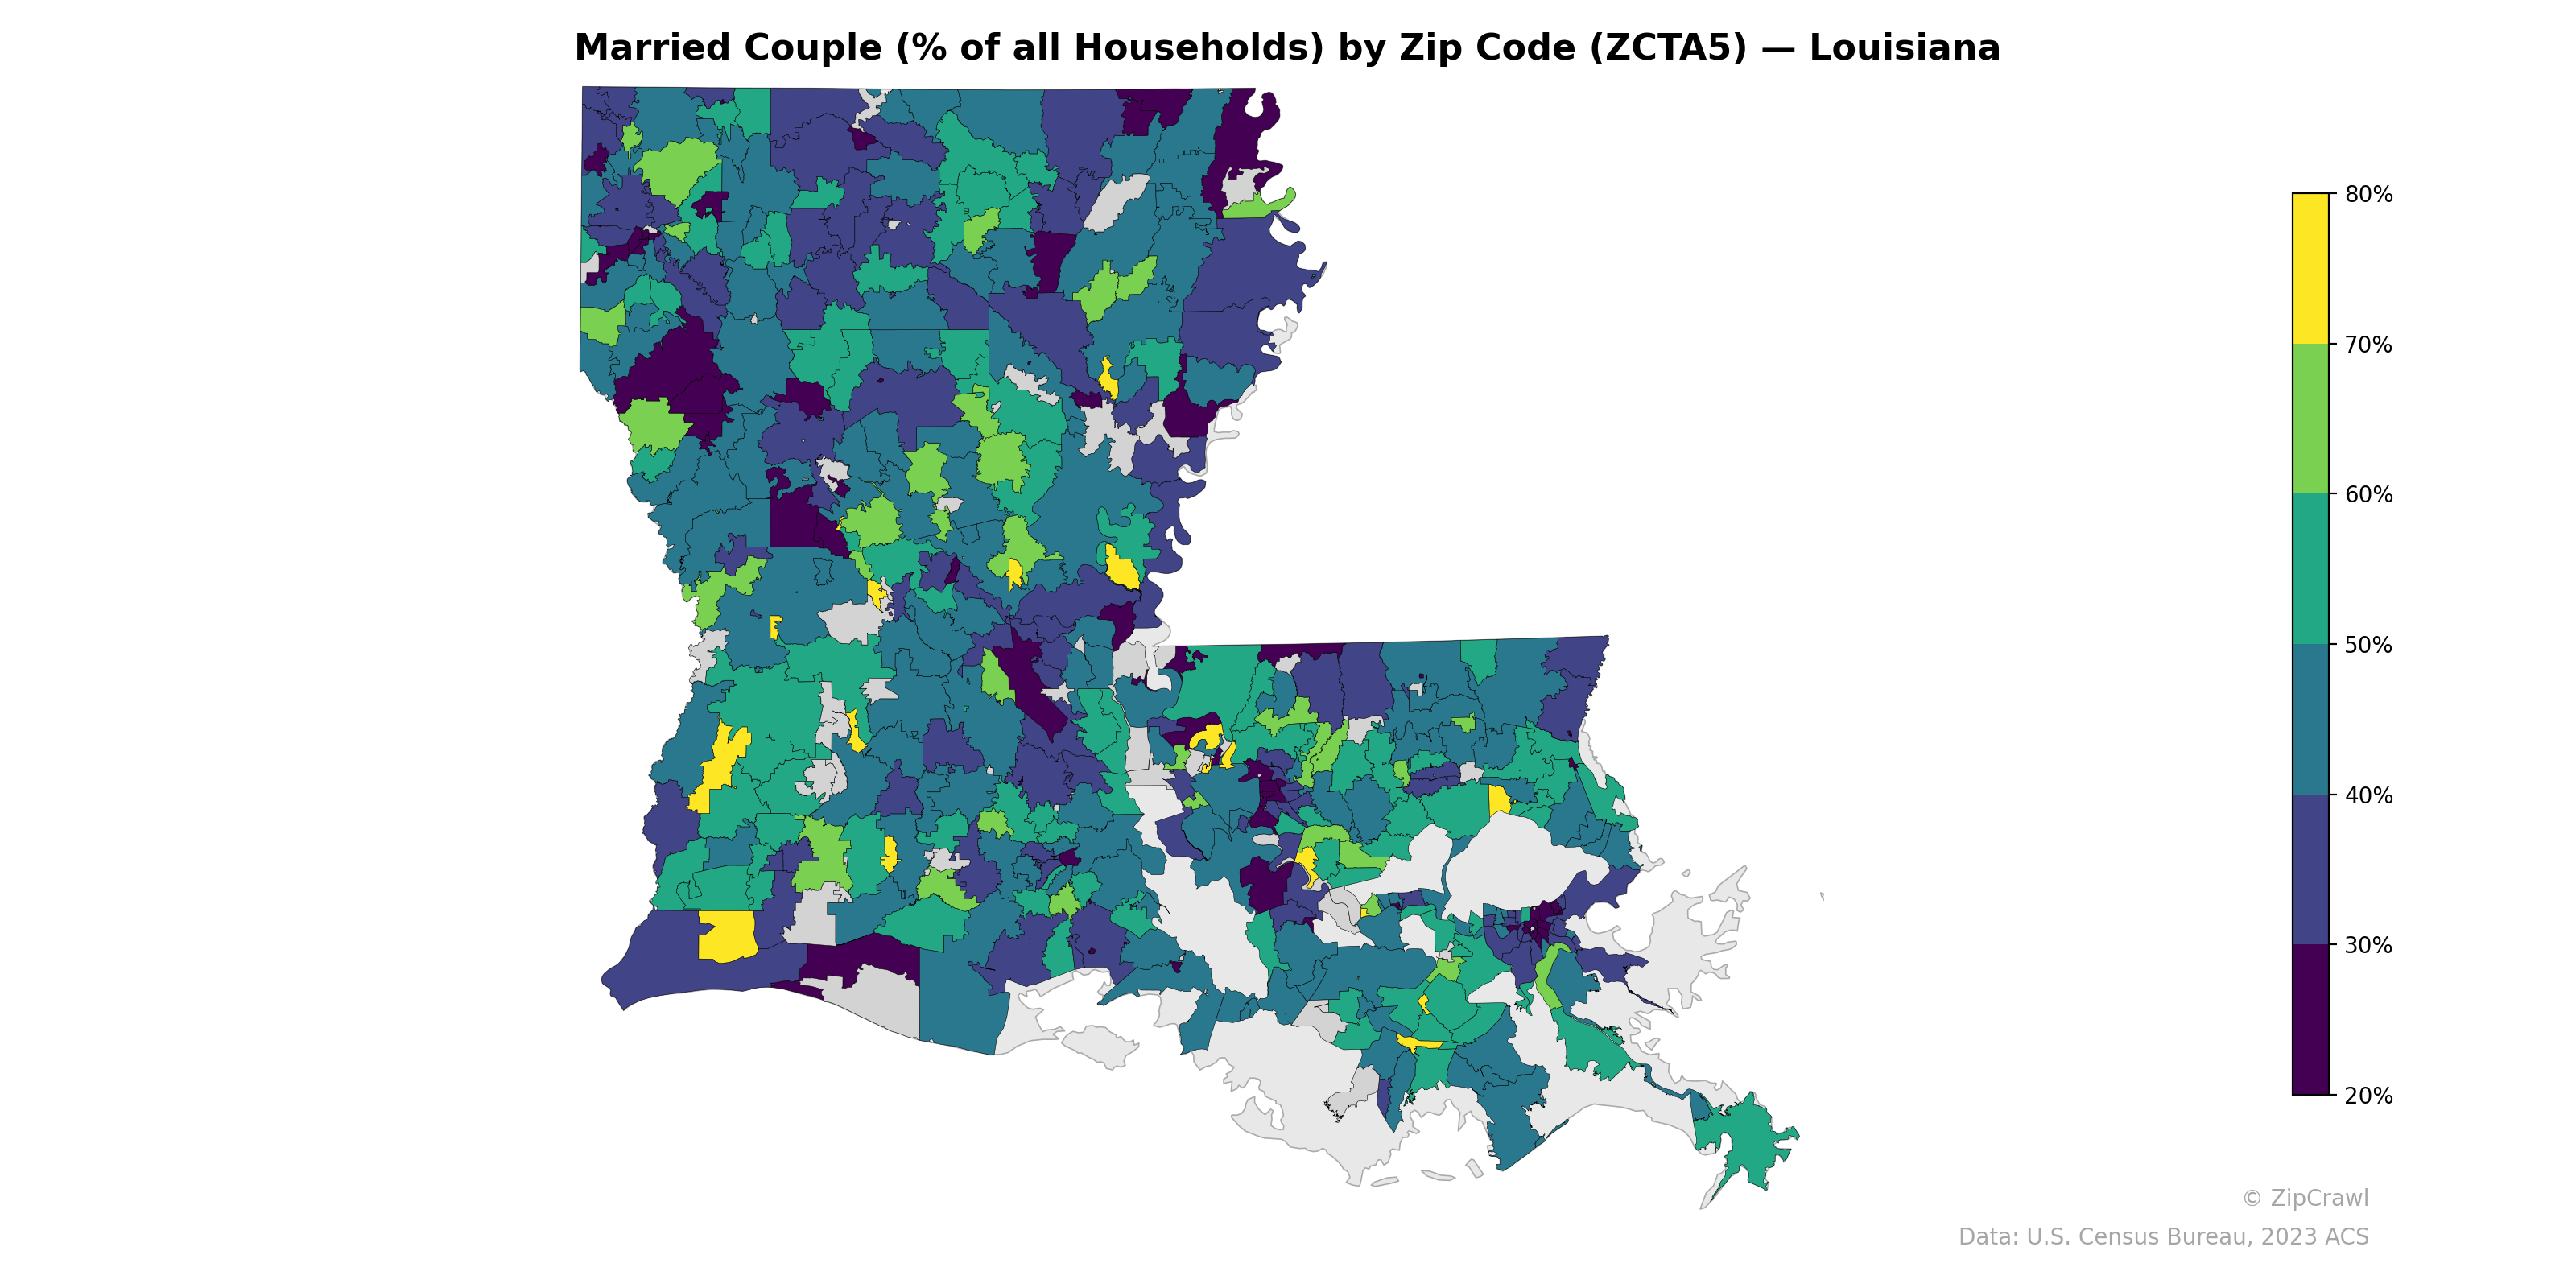
NOTE: Gray indicates insufficient data or a suppressed estimate.
Zip codes in the northwestern corner of the state and scattered rural areas across the Acadiana region exhibit the highest married-couple household rates, frequently exceeding 60–70%, while urban cores—particularly New Orleans in the southeast, Shreveport in the northwest, and Baton Rouge in the east-central area—display notably lower rates, often falling below 30%. A clear urban-rural divide persists statewide, with suburban zip codes surrounding major metros typically registering moderate rates in the 40–55% range, forming transitional bands between high-rate rural areas and low-rate city centers. The Mississippi Delta region in the northeast also stands out with persistently low married-couple percentages, likely reflecting the area's higher poverty rates and distinct demographic composition.
Data: U.S. Census Bureau, 2023 ACS
Explore
- Household Median Income by Zip Code (ZCTA5) — California
- % of Population on Food Stamps or SNAP (Last 12 Months), by Zip Code (ZCTA5) — Louisiana
- U.S. Citizens (% of Population Over 18) by Zip Code (ZCTA5) — Kentucky
- Population Non-Hispanic Asian % by Zip Code (ZCTA5) — Louisiana
- Household Median Income by Zip Code (ZCTA5) — Kentucky
- Population Non-Hispanic Black % by Zip Code (ZCTA5) — Kentucky
- Population Hispanic % by Zip Code (ZCTA5) — Kentucky
- Population Non-Hispanic White % by Zip Code (ZCTA5) — Kentucky
- Housing Vacancy Rate by Zip Code (ZCTA5) — Louisiana
- Median Age by Zip Code (ZCTA5) — Kentucky
- % of Households with Broadband Internet, by County
- Population Non-Hispanic White % by Zip Code (ZCTA5) — California
- Population Non-Hispanic Black % by Zip Code (ZCTA5) — California
- Population Non-Hispanic American Indian % by Zip Code (ZCTA5) — California
- Population Hispanic % by Zip Code (ZCTA5) — California
- Population Non-Hispanic Asian % by Zip Code (ZCTA5) — Texas
- Median Age by Zip Code (ZCTA5) — California
- % of Population on Food Stamps or SNAP (Last 12 Months), by Zip Code (ZCTA5) — Texas
- U.S. Citizens (% of Population Over 18) by Zip Code (ZCTA5) — California
- High School Graduate (% of Over 25) by Zip Code (ZCTA5) — California
- Bachelor's Degree or Higher (% of Over 25) by Zip Code (ZCTA5) — Florida
- Housing Owner-Occupied Median Value ($), by Zip Code (ZCTA5) — Alabama
- Housing Owner-Occupied % of Units, by Zip Code (ZCTA5) — Alabama
- Housing Median Monthly Rent ($), by Zip Code (ZCTA5) — Alabama
- Housing % of Units Built Since 2010, by Zip Code (ZCTA5) — Alabama
- Household Average Size by Zip Code (ZCTA5) — Alabama
- Population Non-Hispanic Asian % by Zip Code (ZCTA5) — Alabama
- % of Population without Health Insurance, by Zip Code (ZCTA5) — Alabama
- % of Households with Broadband Internet, by Zip Code (ZCTA5) — Alabama
- Housing Vacancy Rate by Zip Code (ZCTA5) — Alabama
- Married Couple (% of all Households) by Zip Code (ZCTA5) — Indiana
- Married Couple (% of all Households) by Zip Code (ZCTA5) — Montana
- Married Couple (% of all Households) by Zip Code (ZCTA5) — St. Louis Metro
- Married Couple (% of all Households) by Zip Code (ZCTA5) — Maine
- Married Couple (% of all Households) by Zip Code (ZCTA5) — Ohio
- Married Couple (% of all Households) by Zip Code (ZCTA5) — Arizona
- Married Couple (% of all Households) by Zip Code (ZCTA5) — Alaska
- Married Couple (% of all Households) by Zip Code (ZCTA5) — Utah
- Married Couple (% of all Households) by Zip Code (ZCTA5) — Iowa
- Married Couple (% of all Households) by Zip Code (ZCTA5) — Alabama