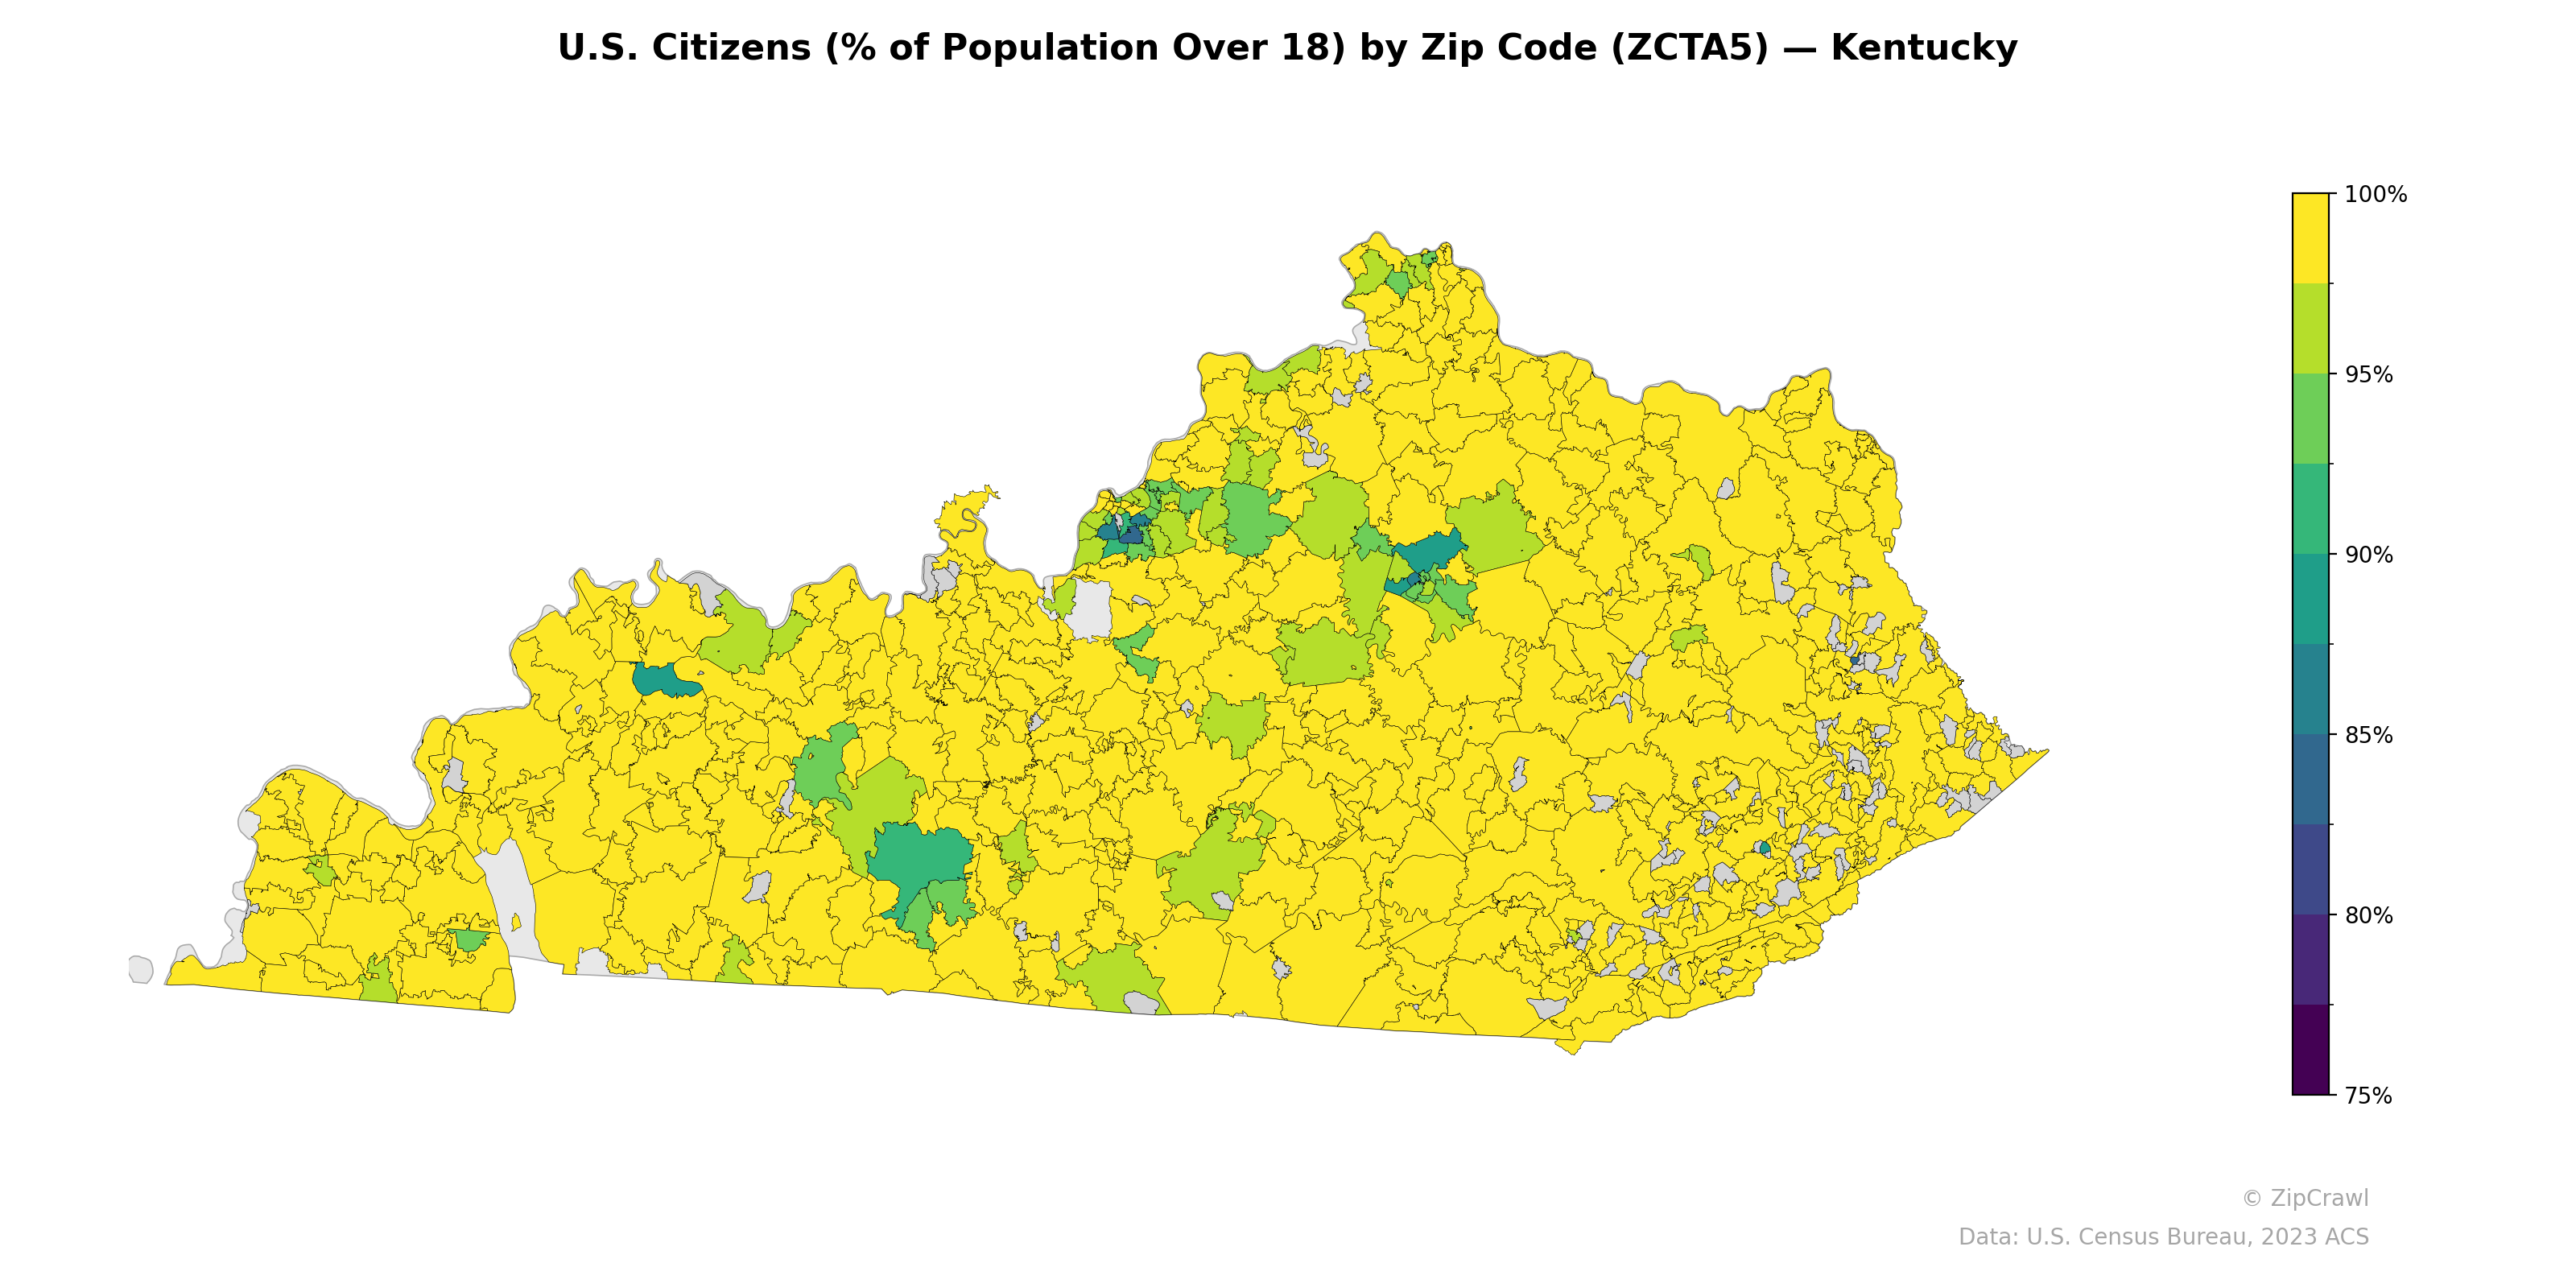
NOTE: Gray indicates insufficient data or a suppressed estimate.
The vast majority of Kentucky zip codes report U.S. citizenship rates above 95% among the adult population, with near-universal citizenship (99–100%) dominating the eastern Appalachian region and rural areas throughout the state. Notable exceptions cluster in the central part of the state around the Louisville and Lexington metro areas, as well as scattered zip codes in south-central Kentucky near Bowling Green, where rates dip to 75–85%, likely reflecting immigrant and refugee communities in those urban centers. A few isolated zip codes along the northern border near Cincinnati also show moderately lower citizenship percentages, consistent with cross-border metropolitan demographic patterns.
Data: U.S. Census Bureau, 2023 ACS
Explore
- Household Median Income by Zip Code (ZCTA5) — California
- Housing Vacancy Rate by Zip Code (ZCTA5) — Louisiana
- Population Hispanic % by Zip Code (ZCTA5) — Kentucky
- Married Couple (% of all Households) by Zip Code (ZCTA5) — Louisiana
- Population Non-Hispanic Black % by Zip Code (ZCTA5) — Kentucky
- Household Median Income by Zip Code (ZCTA5) — Kentucky
- Population Non-Hispanic Asian % by Zip Code (ZCTA5) — Louisiana
- Population Non-Hispanic White % by Zip Code (ZCTA5) — Kentucky
- % of Population on Food Stamps or SNAP (Last 12 Months), by Zip Code (ZCTA5) — Louisiana
- Median Age by Zip Code (ZCTA5) — Kentucky
- % of Households with Broadband Internet, by County
- High School Graduate (% of Over 25) by Zip Code (ZCTA5) — California
- Population Non-Hispanic American Indian % by Zip Code (ZCTA5) — California
- Population Hispanic % by Zip Code (ZCTA5) — California
- Population Non-Hispanic Black % by Zip Code (ZCTA5) — California
- Median Age by Zip Code (ZCTA5) — California
- % of Population on Food Stamps or SNAP (Last 12 Months), by Zip Code (ZCTA5) — Texas
- Population Non-Hispanic Asian % by Zip Code (ZCTA5) — Texas
- Population Non-Hispanic White % by Zip Code (ZCTA5) — California
- Housing Owner-Occupied Median Value ($), by Zip Code (ZCTA5) — Florida
- Housing Median Monthly Rent ($), by Zip Code (ZCTA5) — Alabama
- Housing Owner-Occupied Median Value ($), by Zip Code (ZCTA5) — Alabama
- Housing % of Units Built Since 2010, by Zip Code (ZCTA5) — Alabama
- % of Households with Broadband Internet, by Zip Code (ZCTA5) — Alabama
- Married Couple (% of all Households) by Zip Code (ZCTA5) — Alabama
- Population Non-Hispanic Asian % by Zip Code (ZCTA5) — Alabama
- % of Population without Health Insurance, by Zip Code (ZCTA5) — Alabama
- Housing Owner-Occupied % of Units, by Zip Code (ZCTA5) — Alabama
- Household Average Size by Zip Code (ZCTA5) — Alabama
- Housing Vacancy Rate by Zip Code (ZCTA5) — Alabama
- U.S. Citizens (% of Population Over 18) by Zip Code (ZCTA5) — Utah
- U.S. Citizens (% of Population Over 18) by Zip Code (ZCTA5) — Ohio
- U.S. Citizens (% of Population Over 18) by Zip Code (ZCTA5) — Kansas
- U.S. Citizens (% of Population Over 18) by Zip Code (ZCTA5) — Oregon
- U.S. Citizens (% of Population Over 18) by Zip Code (ZCTA5) — Iowa
- U.S. Citizens (% of Population Over 18) by Zip Code (ZCTA5) — Texas
- U.S. Citizens (% of Population Over 18) by Zip Code (ZCTA5) — Idaho
- U.S. Citizens (% of Population Over 18) by Zip Code (ZCTA5) — Maine
- U.S. Citizens (% of Population Over 18) by Zip Code (ZCTA5) — Colorado
- U.S. Citizens (% of Population Over 18) by Zip Code (ZCTA5) — Nevada