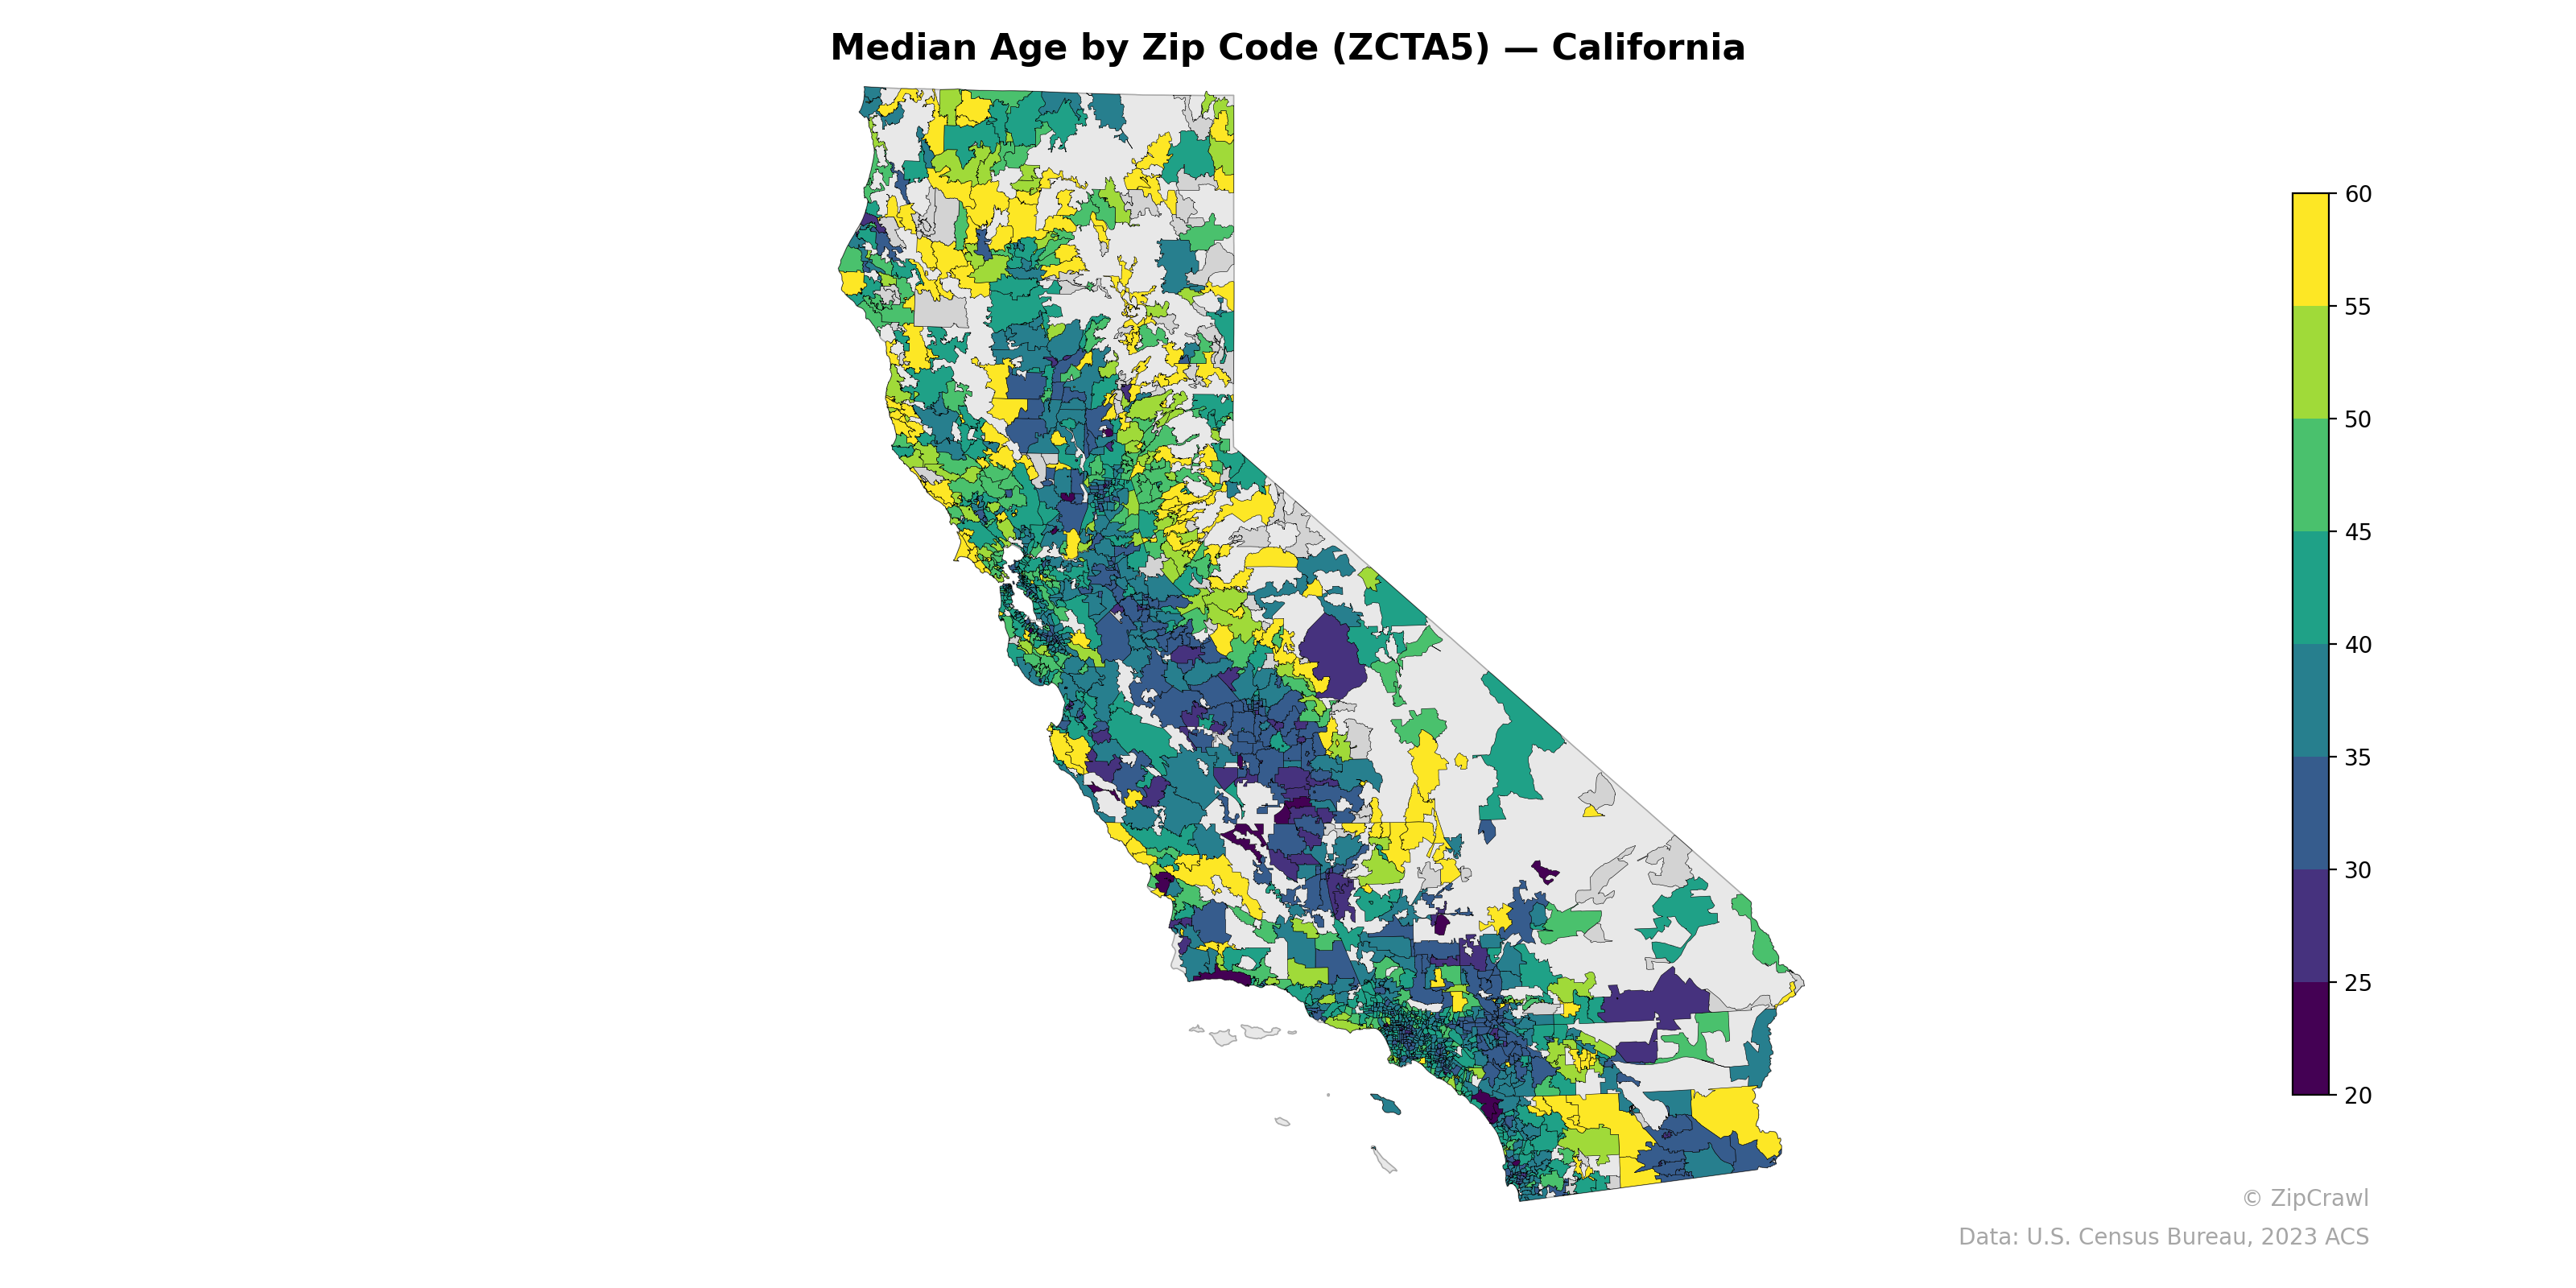
NOTE: Gray indicates insufficient data or a suppressed estimate.
Northern California's rural and coastal counties—particularly along the North Coast and Sierra Nevada foothills—skew notably older with median ages frequently exceeding 50, appearing in yellow and light green tones, while the Central Valley agricultural corridor and dense urban cores of Los Angeles, the Inland Empire, and parts of the Bay Area trend significantly younger, with pockets dipping below 30. The youngest zip codes, shown in deep purple, cluster around university towns and immigrant-heavy urban neighborhoods in Southern California, creating a stark contrast with the retirement-oriented communities along the northern coast. A broad gradient is visible moving from the younger, more diverse southern metro areas northward into the less populated, older-skewing mountain and rural regions of the state.
Data: U.S. Census Bureau, 2023 ACS
Explore
- Bachelor's Degree or Higher (% of Over 25) by Zip Code (ZCTA5) — Kentucky
- % of Population without Health Insurance, by Zip Code (ZCTA5) — Alabama
- Population Non-Hispanic American Indian % by Zip Code (ZCTA5) — Kentucky
- High School Graduate (% of Over 25) by Zip Code (ZCTA5) — Kentucky
- Housing % of Units Built Since 2010, by Zip Code (ZCTA5) — Kentucky
- Household Average Size by Zip Code (ZCTA5) — Kentucky
- Housing Median Monthly Rent ($), by Zip Code (ZCTA5) — Kentucky
- % of Population without Health Insurance, by Zip Code (ZCTA5) — Kentucky
- % of Households with Broadband Internet, by Zip Code (ZCTA5) — Kentucky
- Housing Owner-Occupied Median Value ($), by Zip Code (ZCTA5) — Kentucky
- Housing Owner-Occupied % of Units, by Zip Code (ZCTA5) — Kentucky
- % of Households with Broadband Internet, by County
- High School Graduate (% of Over 25) by Zip Code (ZCTA5) — California
- Population Non-Hispanic American Indian % by Zip Code (ZCTA5) — California
- Population Hispanic % by Zip Code (ZCTA5) — California
- Population Non-Hispanic Black % by Zip Code (ZCTA5) — California
- Population Non-Hispanic Asian % by Zip Code (ZCTA5) — Texas
- U.S. Citizens (% of Population Over 18) by Zip Code (ZCTA5) — California
- % of Population on Food Stamps or SNAP (Last 12 Months), by Zip Code (ZCTA5) — Texas
- Household Median Income by Zip Code (ZCTA5) — California
- Population Non-Hispanic White % by Zip Code (ZCTA5) — California
- Housing % of Units Built Since 2010, by Zip Code (ZCTA5) — Alabama
- Housing Median Monthly Rent ($), by Zip Code (ZCTA5) — Alabama
- Household Average Size by Zip Code (ZCTA5) — Alabama
- % of Households with Broadband Internet, by Zip Code (ZCTA5) — Alabama
- Population Non-Hispanic Asian % by Zip Code (ZCTA5) — Alabama
- Housing Owner-Occupied % of Units, by Zip Code (ZCTA5) — Alabama
- Housing Owner-Occupied Median Value ($), by Zip Code (ZCTA5) — Alabama
- Married Couple (% of all Households) by Zip Code (ZCTA5) — Alabama
- Housing Vacancy Rate by Zip Code (ZCTA5) — Alabama
- Median Age by Zip Code (ZCTA5) — Virginia
- Median Age by Zip Code (ZCTA5) — Utah
- Median Age by Zip Code (ZCTA5) — Ohio
- Median Age by Zip Code (ZCTA5) — Iowa
- Median Age by Zip Code (ZCTA5) — Maine
- Median Age by Zip Code (ZCTA5) — Georgia
- Median Age by Zip Code (ZCTA5) — Texas
- Median Age by Zip Code (ZCTA5) — Idaho
- Median Age by Zip Code (ZCTA5) — Indiana
- Median Age by Zip Code (ZCTA5) — Alaska