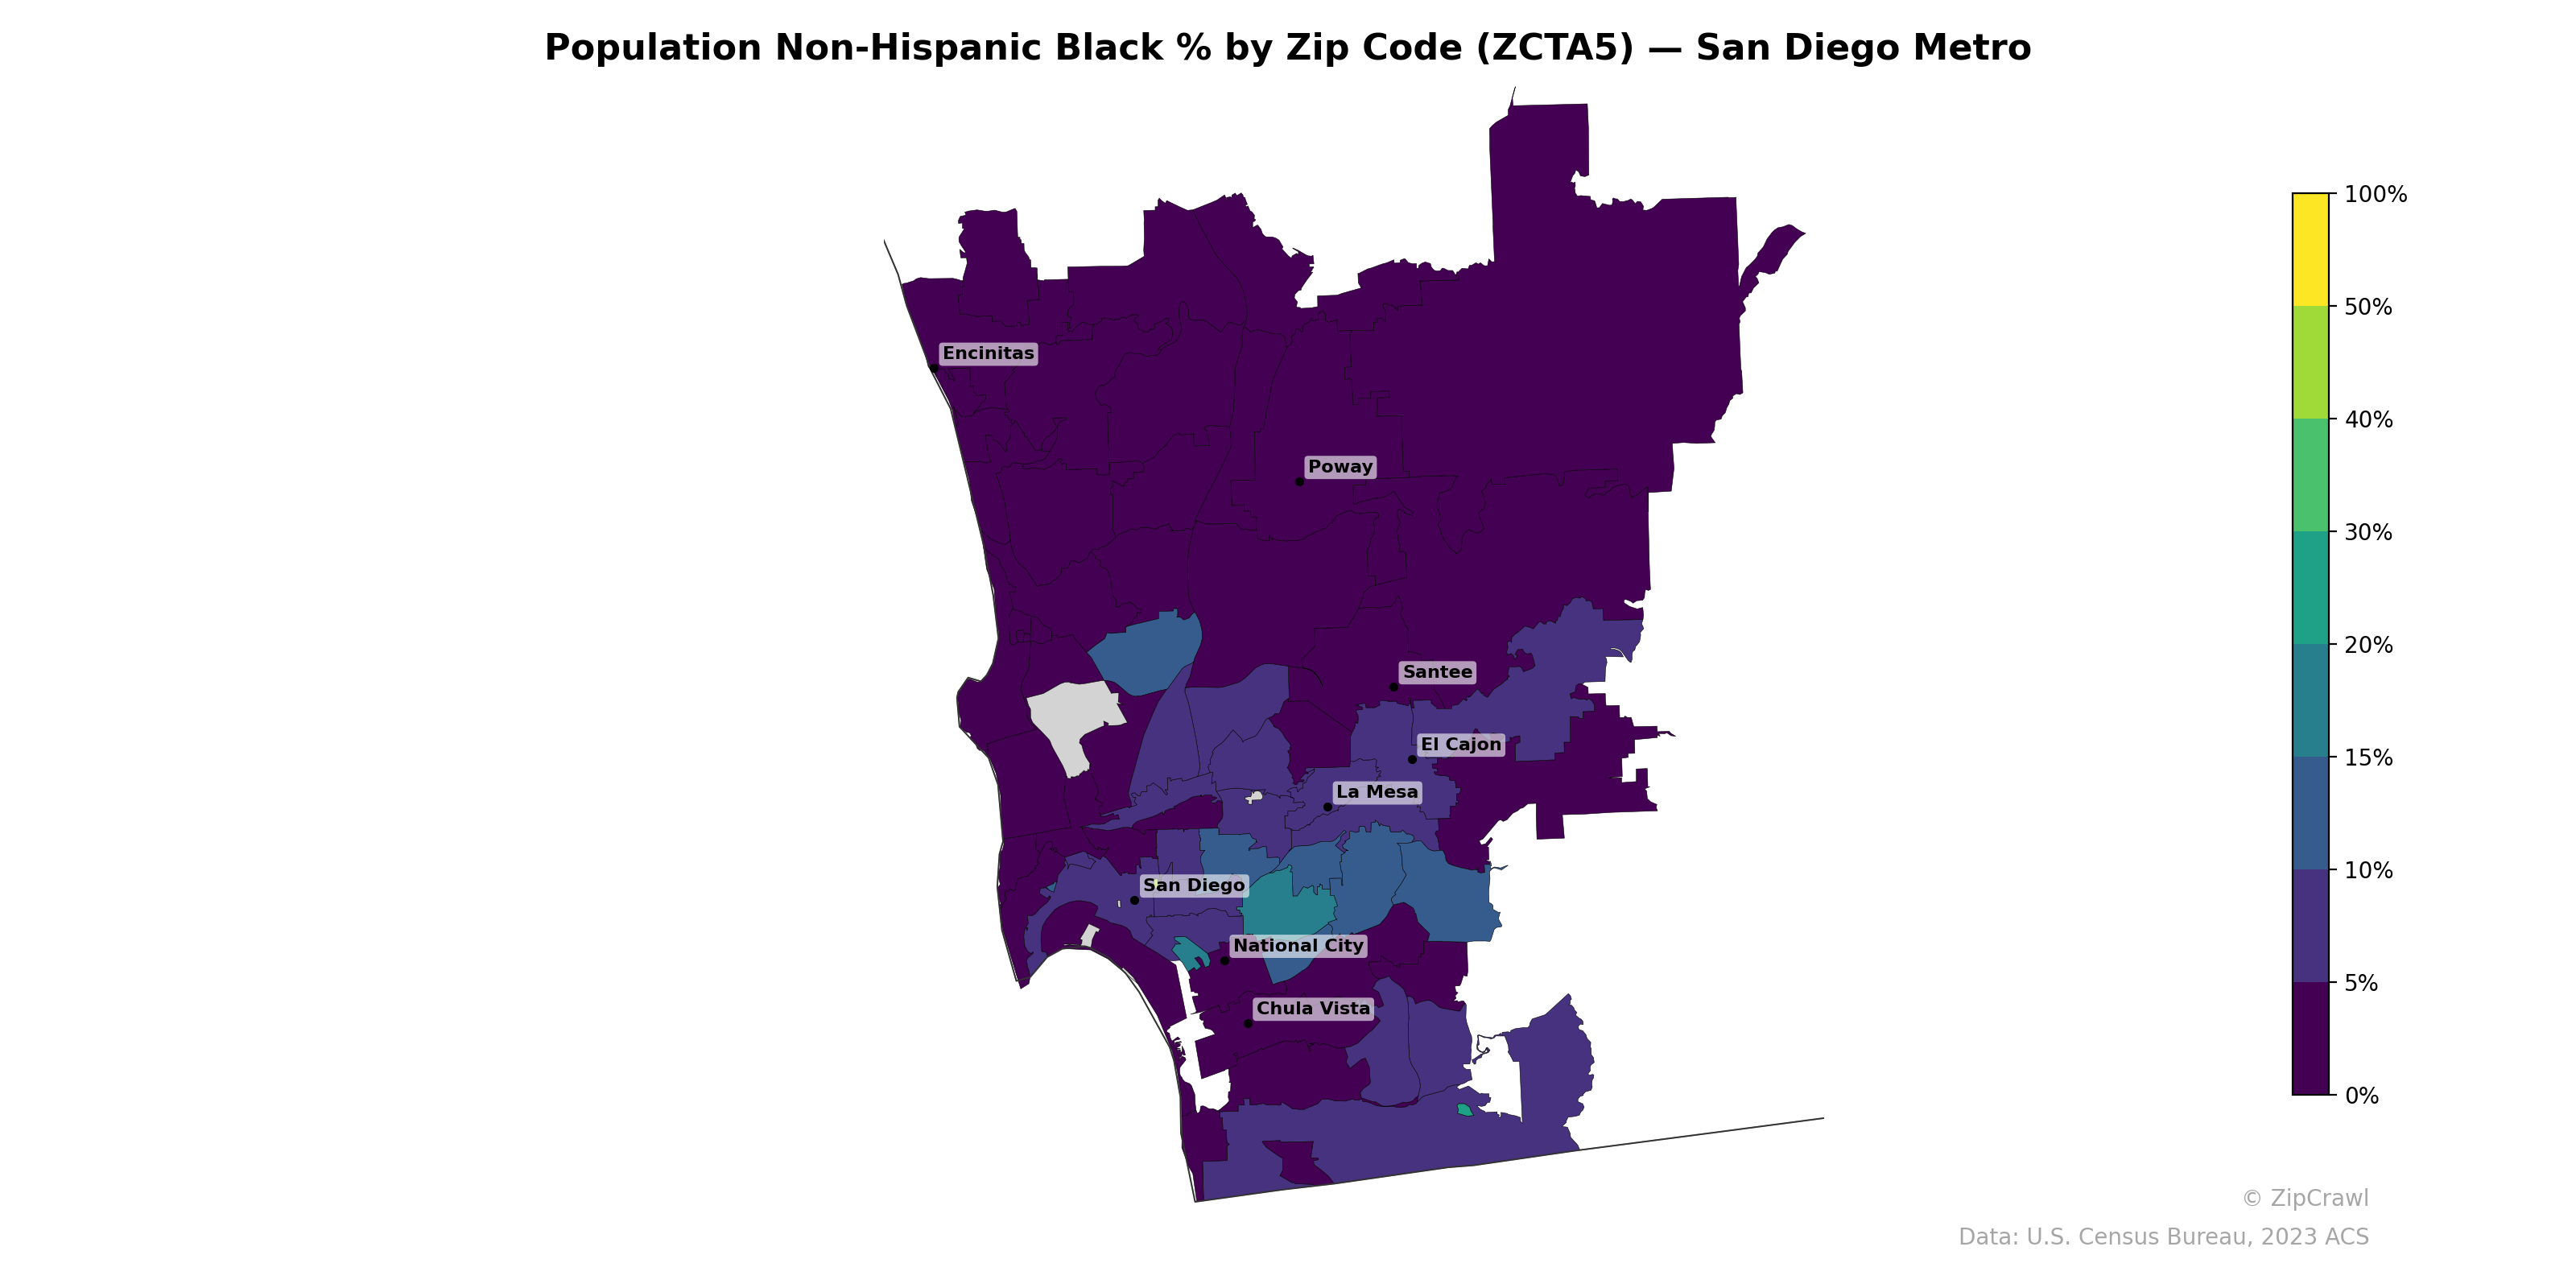
NOTE: Gray indicates insufficient data or a suppressed estimate.
The highest concentrations of Non-Hispanic Black residents in the San Diego metro cluster in a corridor stretching from central San Diego through the areas just south and east of downtown, particularly around the neighborhoods near National City and parts of southeastern San Diego, where percentages appear to reach roughly 10–20%. Suburban and inland communities such as Santee, Poway, Encinitas, and Chula Vista register notably lower shares, generally below 5%, as do the rural and exurban zip codes in the northeastern portion of the metro. The overall pattern reflects a sharp urban-suburban divide, with Black population share dropping off quickly outside a relatively compact set of central and south-central zip codes.
Data: U.S. Census Bureau, 2023 ACS
Explore
- % of Population without Health Insurance, by Zip Code (ZCTA5) — Chicago Metro
- Population Non-Hispanic American Indian % by Zip Code (ZCTA5) — San Diego Metro
- % of Population on Food Stamps or SNAP (Last 12 Months), by Zip Code (ZCTA5) — Tampa Metro
- Median Age by Zip Code (ZCTA5) — San Diego Metro
- High School Graduate (% of Over 25) by Zip Code (ZCTA5) — San Diego Metro
- Population Non-Hispanic White % by Zip Code (ZCTA5) — San Diego Metro
- Household Median Income by Zip Code (ZCTA5) — San Diego Metro
- U.S. Citizens (% of Population Over 18) by Zip Code (ZCTA5) — San Diego Metro
- Population Non-Hispanic Asian % by Zip Code (ZCTA5) — Tampa Metro
- Population Hispanic % by Zip Code (ZCTA5) — San Diego Metro
- Population Non-Hispanic American Indian % by County
- Married Couple (% of all Households) by Zip Code (ZCTA5) — Chicago Metro
- Housing Vacancy Rate by Zip Code (ZCTA5) — Chicago Metro
- Housing Owner-Occupied % of Units, by Zip Code (ZCTA5) — Chicago Metro
- Housing Median Monthly Rent ($), by Zip Code (ZCTA5) — Chicago Metro
- Bachelor's Degree or Higher (% of Over 25) by Zip Code (ZCTA5) — Chicago Metro
- Housing % of Units Built Since 2010, by Zip Code (ZCTA5) — Chicago Metro
- % of Households with Broadband Internet, by Zip Code (ZCTA5) — Chicago Metro
- Population Non-Hispanic American Indian % by Zip Code (ZCTA5) — New York Metro
- Housing Owner-Occupied Median Value ($), by Zip Code (ZCTA5) — Chicago Metro
- Household Average Size by Zip Code (ZCTA5) — Chicago Metro
- Housing Owner-Occupied % of Units, by Zip Code (ZCTA5) — Denver Metro
- % of Households with Broadband Internet, by Zip Code (ZCTA5) — Denver Metro
- Housing Owner-Occupied Median Value ($), by Zip Code (ZCTA5) — Denver Metro
- Population Non-Hispanic White % by Zip Code (ZCTA5) — Denver Metro
- Median Age by Zip Code (ZCTA5) — Denver Metro
- High School Graduate (% of Over 25) by Zip Code (ZCTA5) — Denver Metro
- Bachelor's Degree or Higher (% of Over 25) by Zip Code (ZCTA5) — Denver Metro
- % of Population without Health Insurance, by Zip Code (ZCTA5) — Denver Metro
- Population Hispanic % by Zip Code (ZCTA5) — Denver Metro
- Population Non-Hispanic Black % by Zip Code (ZCTA5) — San Antonio Metro
- Population Non-Hispanic Black % by Zip Code (ZCTA5) — Detroit Metro
- Population Non-Hispanic Black % by Zip Code (ZCTA5) — Dallas Metro
- Population Non-Hispanic Black % by Zip Code (ZCTA5) — Chicago Metro
- Population Non-Hispanic Black % by Zip Code (ZCTA5) — Denver Metro
- Population Non-Hispanic Black % by Zip Code (ZCTA5) — San Francisco Metro
- Population Non-Hispanic Black % by Zip Code (ZCTA5) — Boston Metro
- Population Non-Hispanic Black % by Zip Code (ZCTA5) — Miami Metro
- Population Non-Hispanic Black % by Zip Code (ZCTA5) — Seattle Metro
- Population Non-Hispanic Black % by Zip Code (ZCTA5) — Houston Metro