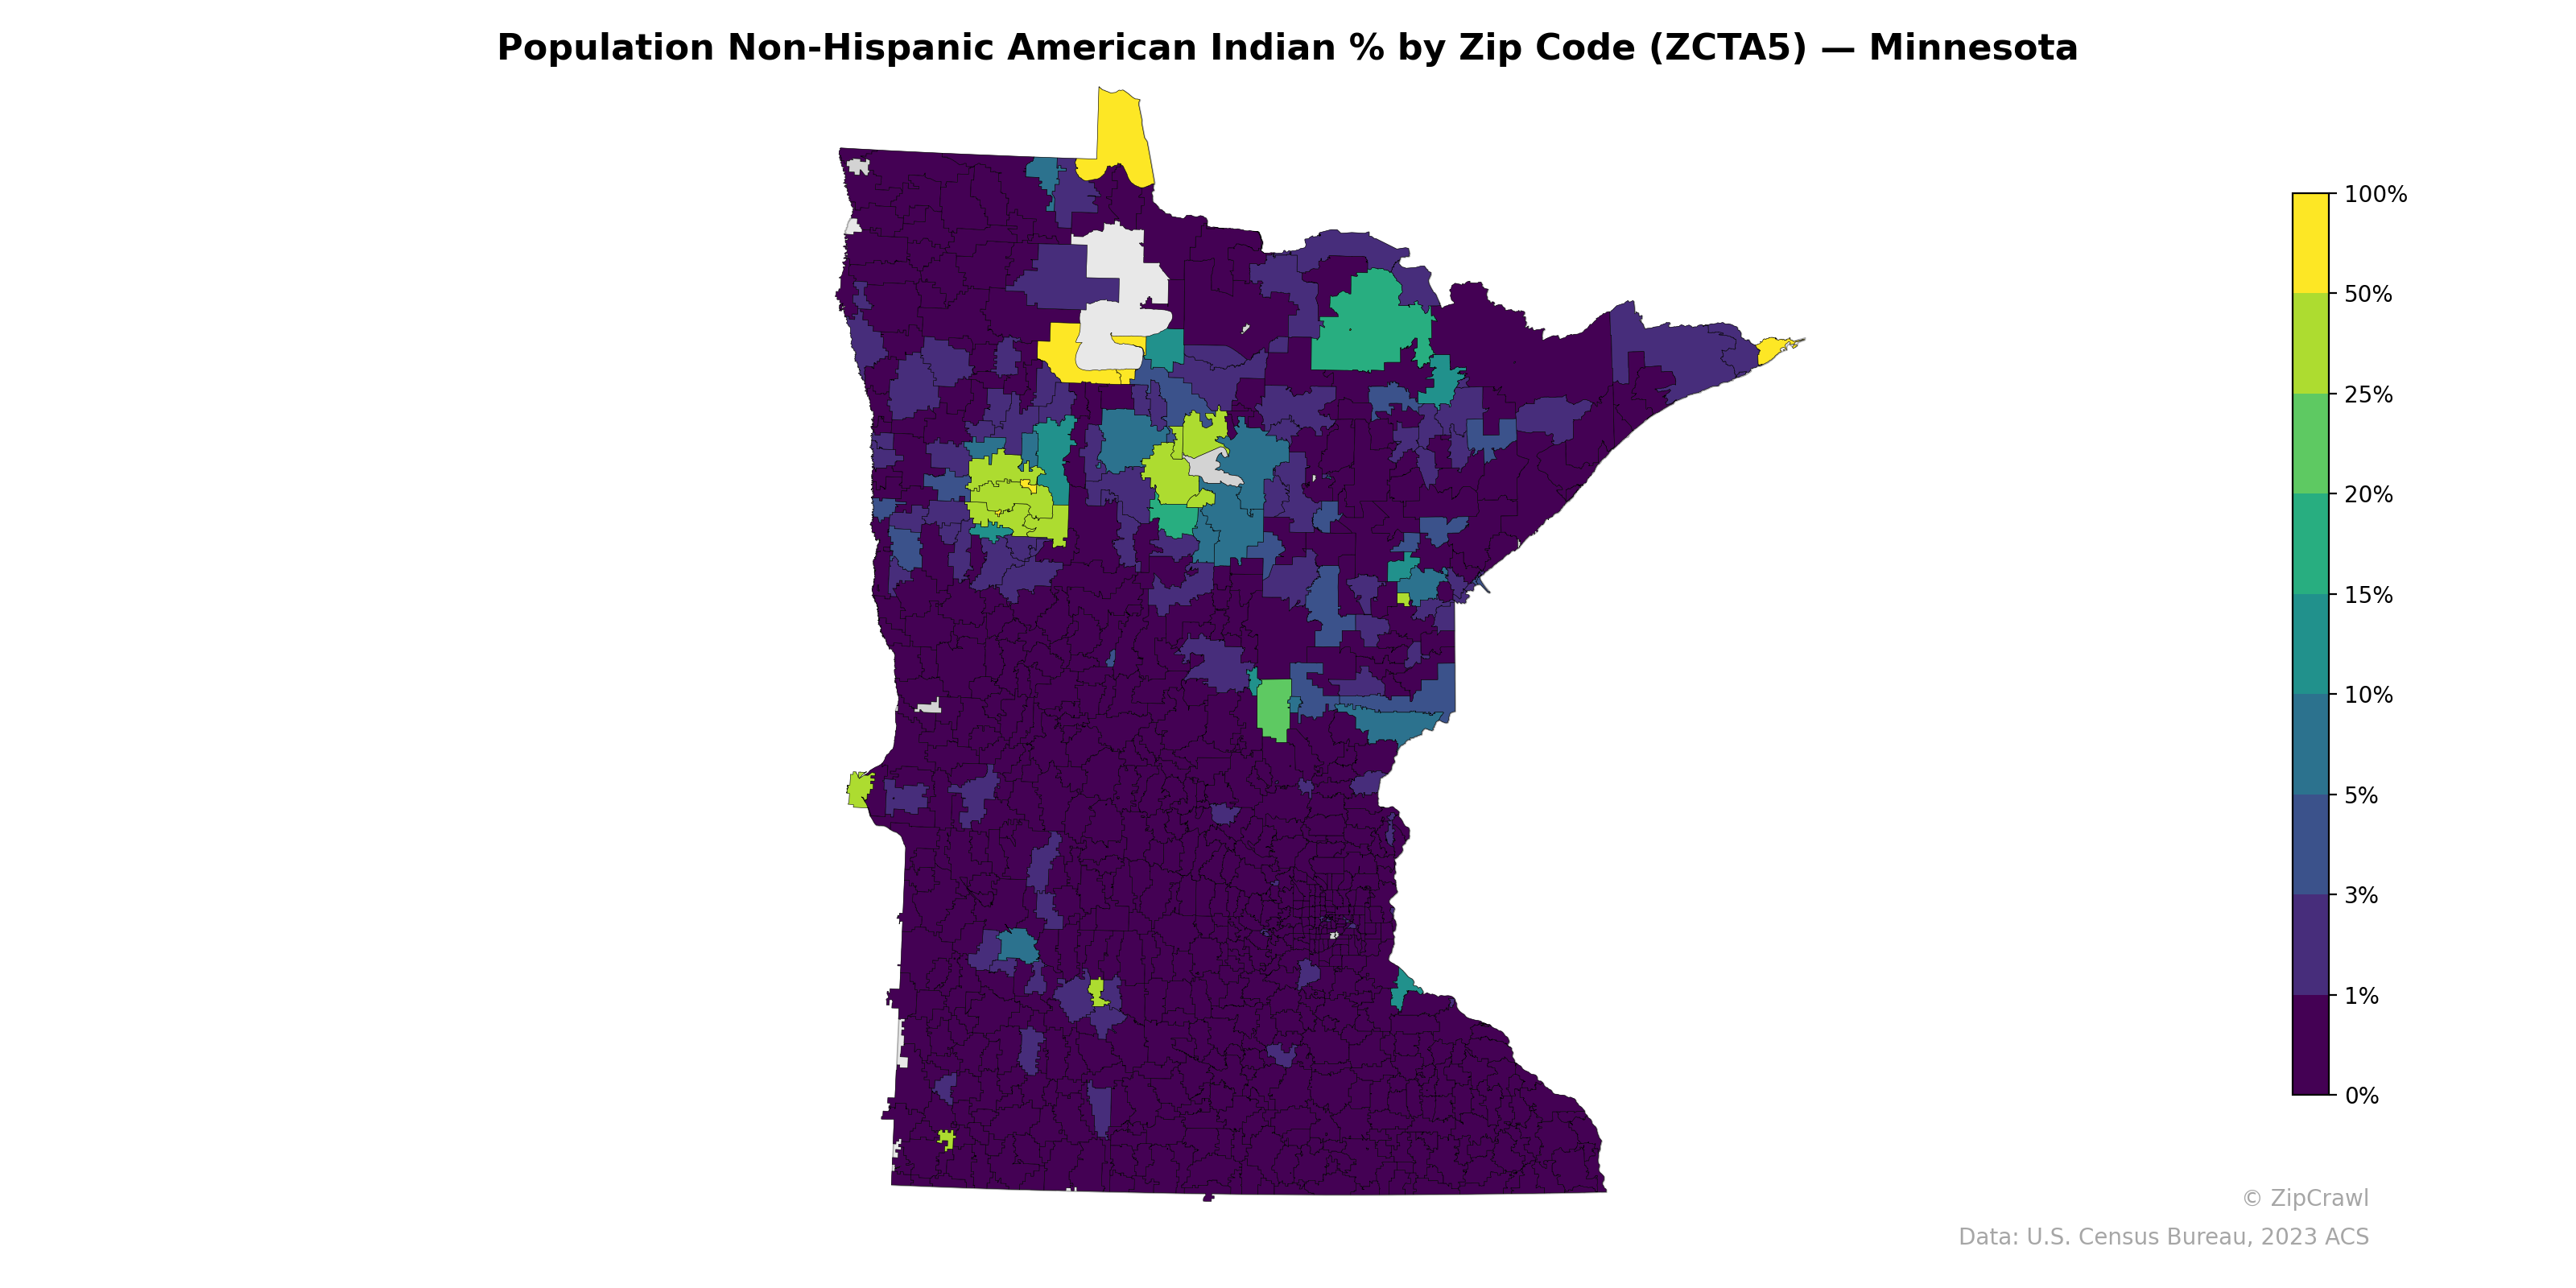
NOTE: Gray indicates insufficient data or a suppressed estimate.
Non-Hispanic American Indian population concentrations are heavily clustered in northern Minnesota, particularly around the Red Lake, White Earth, and Leech Lake reservation areas in the north-central region, where several zip codes exceed 25–50% and at least one approaches 100%. A secondary cluster of elevated percentages appears in the east-central part of the state near the Mille Lacs reservation, along with smaller pockets in the southwest (likely near the Prairie Island and Lower Sioux communities) and the far southeastern corner. The southern half of the state and the Twin Cities metropolitan area are overwhelmingly below 1%, creating a stark north-south divide in the spatial distribution of this population.
Data: U.S. Census Bureau, 2023 ACS
Explore
- % of Population without Health Insurance, by Zip Code (ZCTA5) — Texas
- High School Graduate (% of Over 25) by Zip Code (ZCTA5) — Minnesota
- Bachelor's Degree or Higher (% of Over 25) by Zip Code (ZCTA5) — Minnesota
- % of Households with Broadband Internet, by Zip Code (ZCTA5) — Minnesota
- % of Population without Health Insurance, by Zip Code (ZCTA5) — Minnesota
- Household Average Size by Zip Code (ZCTA5) — Minnesota
- Housing Owner-Occupied Median Value ($), by Zip Code (ZCTA5) — Minnesota
- Housing % of Units Built Since 2010, by Zip Code (ZCTA5) — Minnesota
- Housing Median Monthly Rent ($), by Zip Code (ZCTA5) — Minnesota
- Housing Owner-Occupied % of Units, by Zip Code (ZCTA5) — Minnesota
- Bachelor's Degree or Higher (% of Over 25) by County
- Married Couple (% of all Households) by Zip Code (ZCTA5) — Texas
- Housing Owner-Occupied % of Units, by Zip Code (ZCTA5) — Texas
- Housing Owner-Occupied Median Value ($), by Zip Code (ZCTA5) — Texas
- Housing Vacancy Rate by Zip Code (ZCTA5) — Texas
- Housing % of Units Built Since 2010, by Zip Code (ZCTA5) — Texas
- Housing Median Monthly Rent ($), by Zip Code (ZCTA5) — Texas
- Bachelor's Degree or Higher (% of Over 25) by Zip Code (ZCTA5) — Texas
- % of Population on Food Stamps or SNAP (Last 12 Months), by County
- % of Households with Broadband Internet, by Zip Code (ZCTA5) — Texas
- Household Average Size by Zip Code (ZCTA5) — Texas
- Bachelor's Degree or Higher (% of Over 25) by Zip Code (ZCTA5) — Wisconsin
- Population Non-Hispanic Black % by Zip Code (ZCTA5) — Wisconsin
- Population Non-Hispanic White % by Zip Code (ZCTA5) — Wisconsin
- Population Non-Hispanic Asian % by Zip Code (ZCTA5) — Wisconsin
- High School Graduate (% of Over 25) by Zip Code (ZCTA5) — Wisconsin
- % of Population on Food Stamps or SNAP (Last 12 Months), by Zip Code (ZCTA5) — Wisconsin
- Median Age by Zip Code (ZCTA5) — Wisconsin
- Household Average Size by Zip Code (ZCTA5) — Wisconsin
- Population Hispanic % by Zip Code (ZCTA5) — Wisconsin
- Population Non-Hispanic American Indian % by Zip Code (ZCTA5) — Indiana
- Population Non-Hispanic American Indian % by Zip Code (ZCTA5) — Michigan
- Population Non-Hispanic American Indian % by Zip Code (ZCTA5) — Maine
- Population Non-Hispanic American Indian % by Zip Code (ZCTA5) — Iowa
- Population Non-Hispanic American Indian % by Zip Code (ZCTA5) — Missouri
- Population Non-Hispanic American Indian % by Zip Code (ZCTA5) — Idaho
- Population Non-Hispanic American Indian % by Zip Code (ZCTA5) — Ohio
- Population Non-Hispanic American Indian % by Zip Code (ZCTA5) — Utah
- Population Non-Hispanic American Indian % by Zip Code (ZCTA5) — Tennessee
- Population Non-Hispanic American Indian % by Zip Code (ZCTA5) — Mississippi