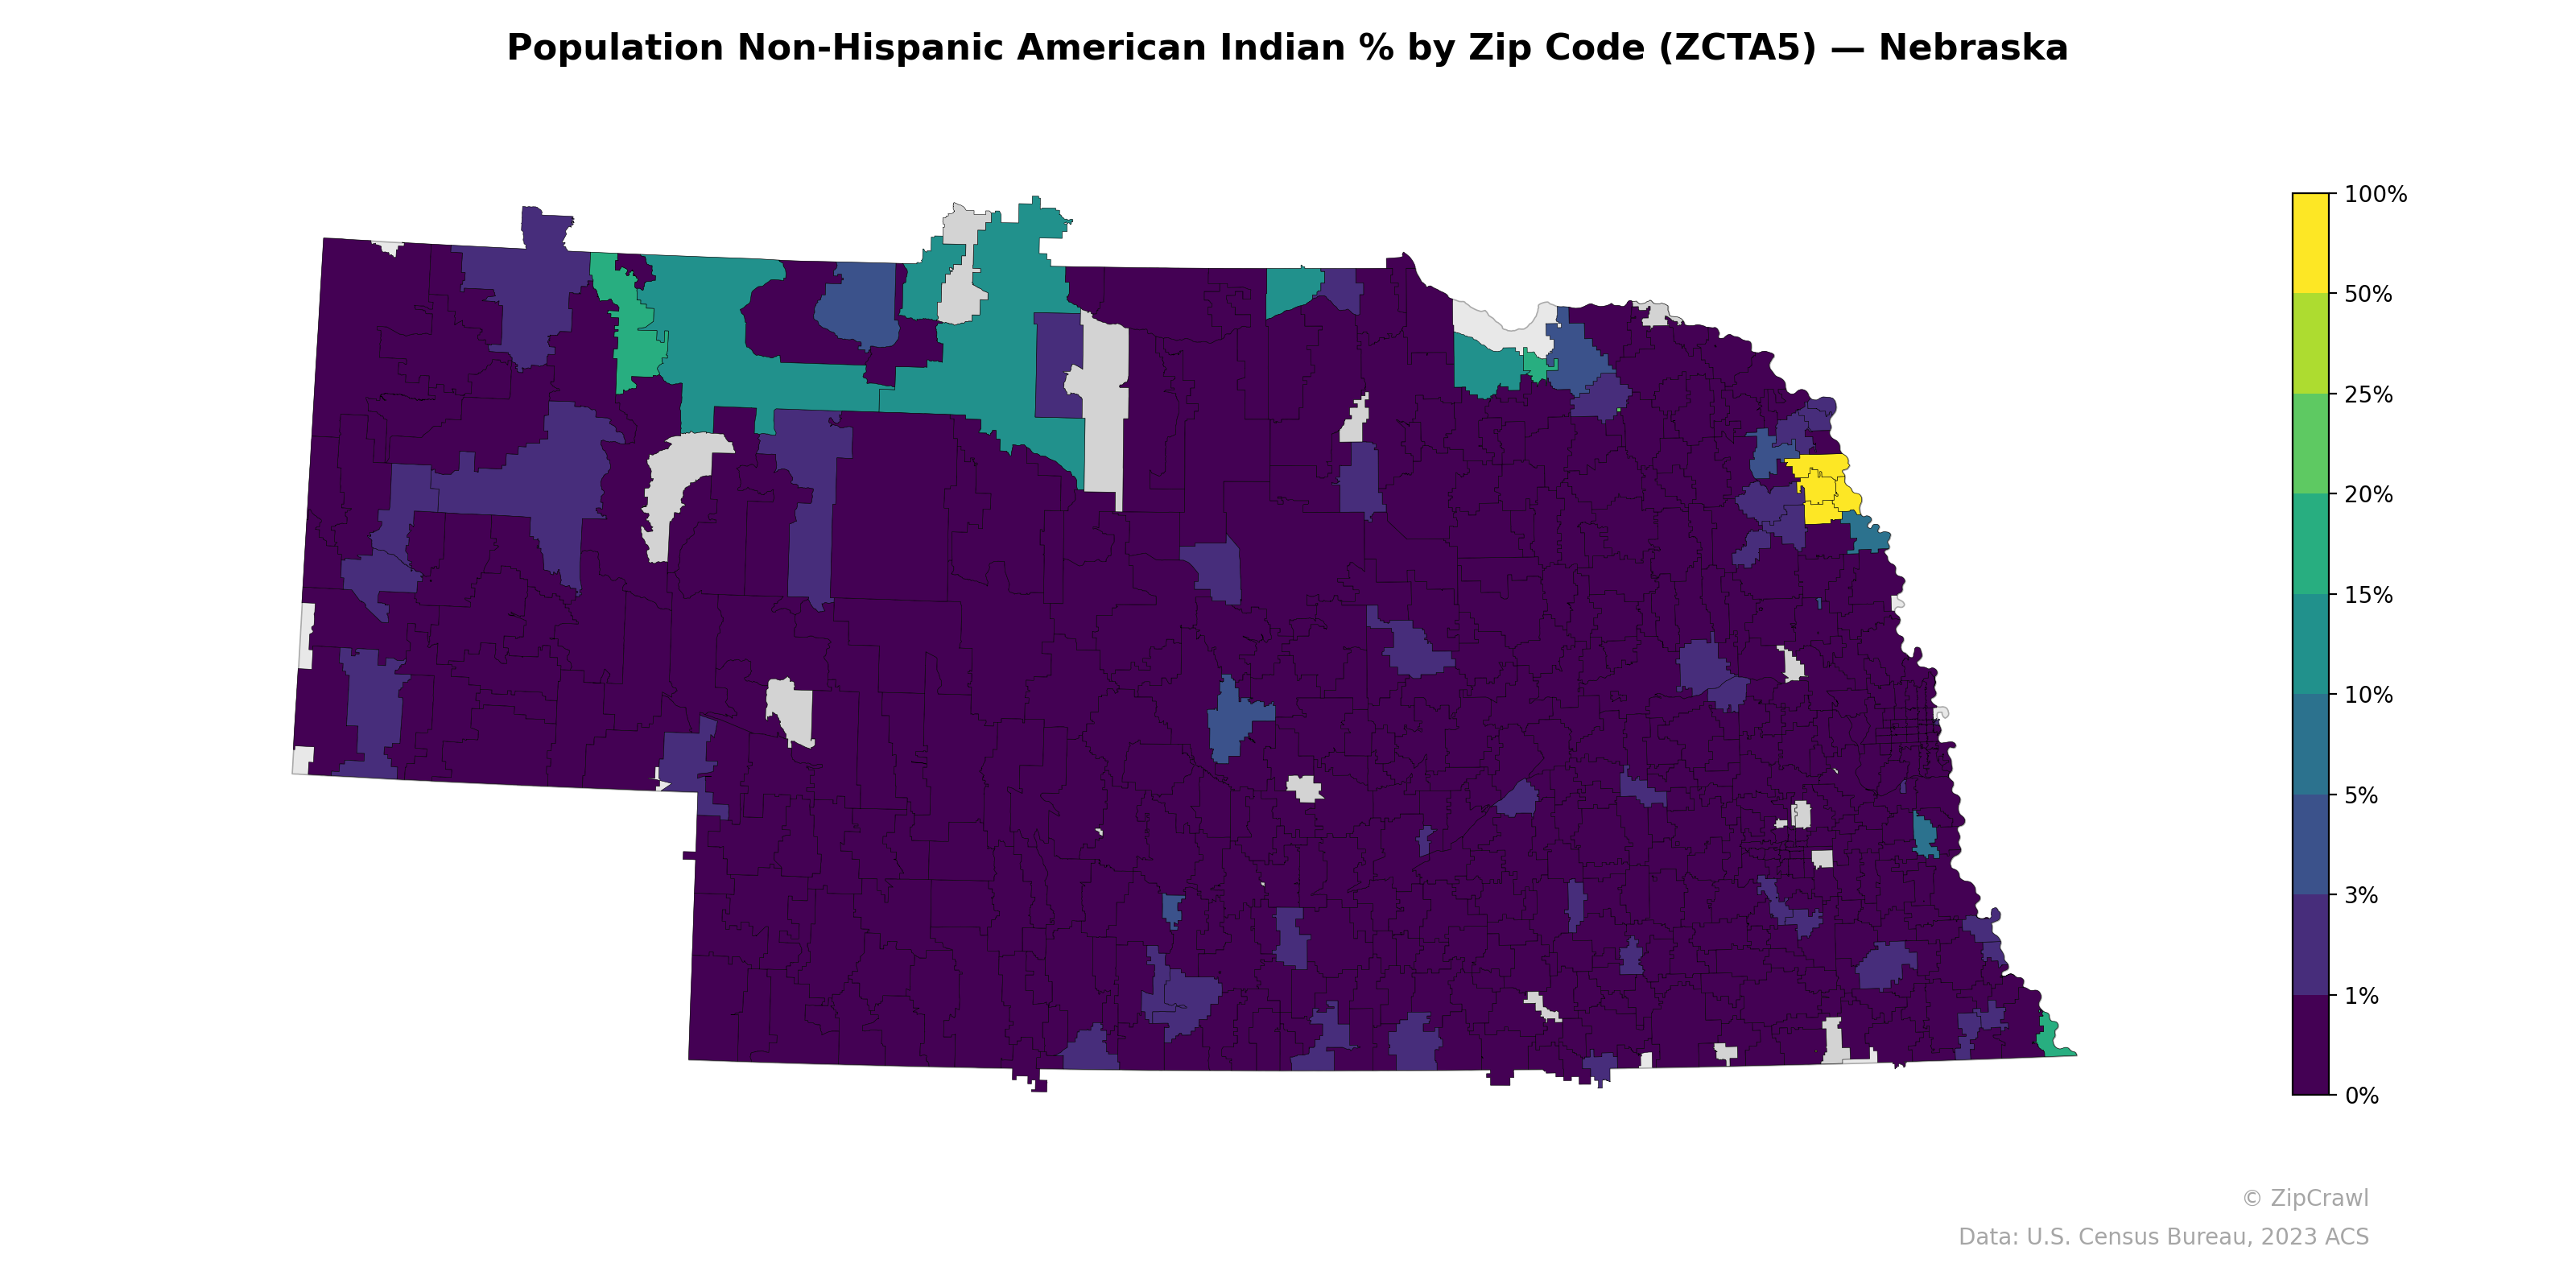
NOTE: Gray indicates insufficient data or a suppressed estimate.
The highest concentrations of Non-Hispanic American Indian population are clustered in the northwestern portion of the state, corresponding to the Pine Ridge and Rosebud reservations in Sheridan, Dawes, and surrounding counties, where several zip codes exceed 25–50%. A notable secondary cluster appears in the northeastern part of the state near Thurston County, where the Omaha and Winnebago reservations drive zip codes to near 100% representation, visible as the bright yellow area along the eastern border. The vast majority of central and southern Nebraska zip codes fall below 1%, creating a stark demographic contrast between reservation-adjacent areas and the remainder of the state.
Data: U.S. Census Bureau, 2023 ACS
Explore
- Housing % of Units Built Since 2010, by Zip Code (ZCTA5) — Florida
- Housing % of Units Built Since 2010, by Zip Code (ZCTA5) — Nebraska
- Housing Owner-Occupied % of Units, by Zip Code (ZCTA5) — Nebraska
- % of Households with Broadband Internet, by Zip Code (ZCTA5) — Nebraska
- High School Graduate (% of Over 25) by Zip Code (ZCTA5) — Nebraska
- Household Average Size by Zip Code (ZCTA5) — Nebraska
- % of Population without Health Insurance, by Zip Code (ZCTA5) — Nebraska
- Housing Median Monthly Rent ($), by Zip Code (ZCTA5) — Nebraska
- Housing Owner-Occupied Median Value ($), by Zip Code (ZCTA5) — Nebraska
- Bachelor's Degree or Higher (% of Over 25) by Zip Code (ZCTA5) — Nebraska
- Housing Median Monthly Rent ($), by County
- Household Average Size by Zip Code (ZCTA5) — Florida
- Married Couple (% of all Households) by Zip Code (ZCTA5) — Florida
- Housing Vacancy Rate by Zip Code (ZCTA5) — Florida
- Population Non-Hispanic Asian % by Zip Code (ZCTA5) — New Jersey
- Housing Owner-Occupied Median Value ($), by Zip Code (ZCTA5) — Florida
- % of Population without Health Insurance, by Zip Code (ZCTA5) — Florida
- Housing Median Monthly Rent ($), by Zip Code (ZCTA5) — Florida
- Population Non-Hispanic Asian % by Zip Code (ZCTA5) — New York
- % of Households with Broadband Internet, by Zip Code (ZCTA5) — Florida
- Bachelor's Degree or Higher (% of Over 25) by Zip Code (ZCTA5) — Florida
- Housing Owner-Occupied % of Units, by Zip Code (ZCTA5) — Florida
- Population Non-Hispanic Asian % by Zip Code (ZCTA5) — Mississippi
- % of Households with Broadband Internet, by Zip Code (ZCTA5) — Mississippi
- % of Population on Food Stamps or SNAP (Last 12 Months), by Zip Code (ZCTA5) — Mississippi
- Median Age by Zip Code (ZCTA5) — Idaho
- High School Graduate (% of Over 25) by Zip Code (ZCTA5) — Mississippi
- % of Population without Health Insurance, by Zip Code (ZCTA5) — Mississippi
- Bachelor's Degree or Higher (% of Over 25) by Zip Code (ZCTA5) — Mississippi
- Housing Vacancy Rate by Zip Code (ZCTA5) — Mississippi
- Population Non-Hispanic American Indian % by Zip Code (ZCTA5) — Alaska
- Population Non-Hispanic American Indian % by Zip Code (ZCTA5) — Indiana
- Population Non-Hispanic American Indian % by Zip Code (ZCTA5) — Nevada
- Population Non-Hispanic American Indian % by Zip Code (ZCTA5) — Iowa
- Population Non-Hispanic American Indian % by Zip Code (ZCTA5) — Idaho
- Population Non-Hispanic American Indian % by Zip Code (ZCTA5) — Utah
- Population Non-Hispanic American Indian % by Zip Code (ZCTA5) — Ohio
- Population Non-Hispanic American Indian % by Zip Code (ZCTA5) — New York
- Population Non-Hispanic American Indian % by Zip Code (ZCTA5) — Oregon
- Population Non-Hispanic American Indian % by Zip Code (ZCTA5) — Texas