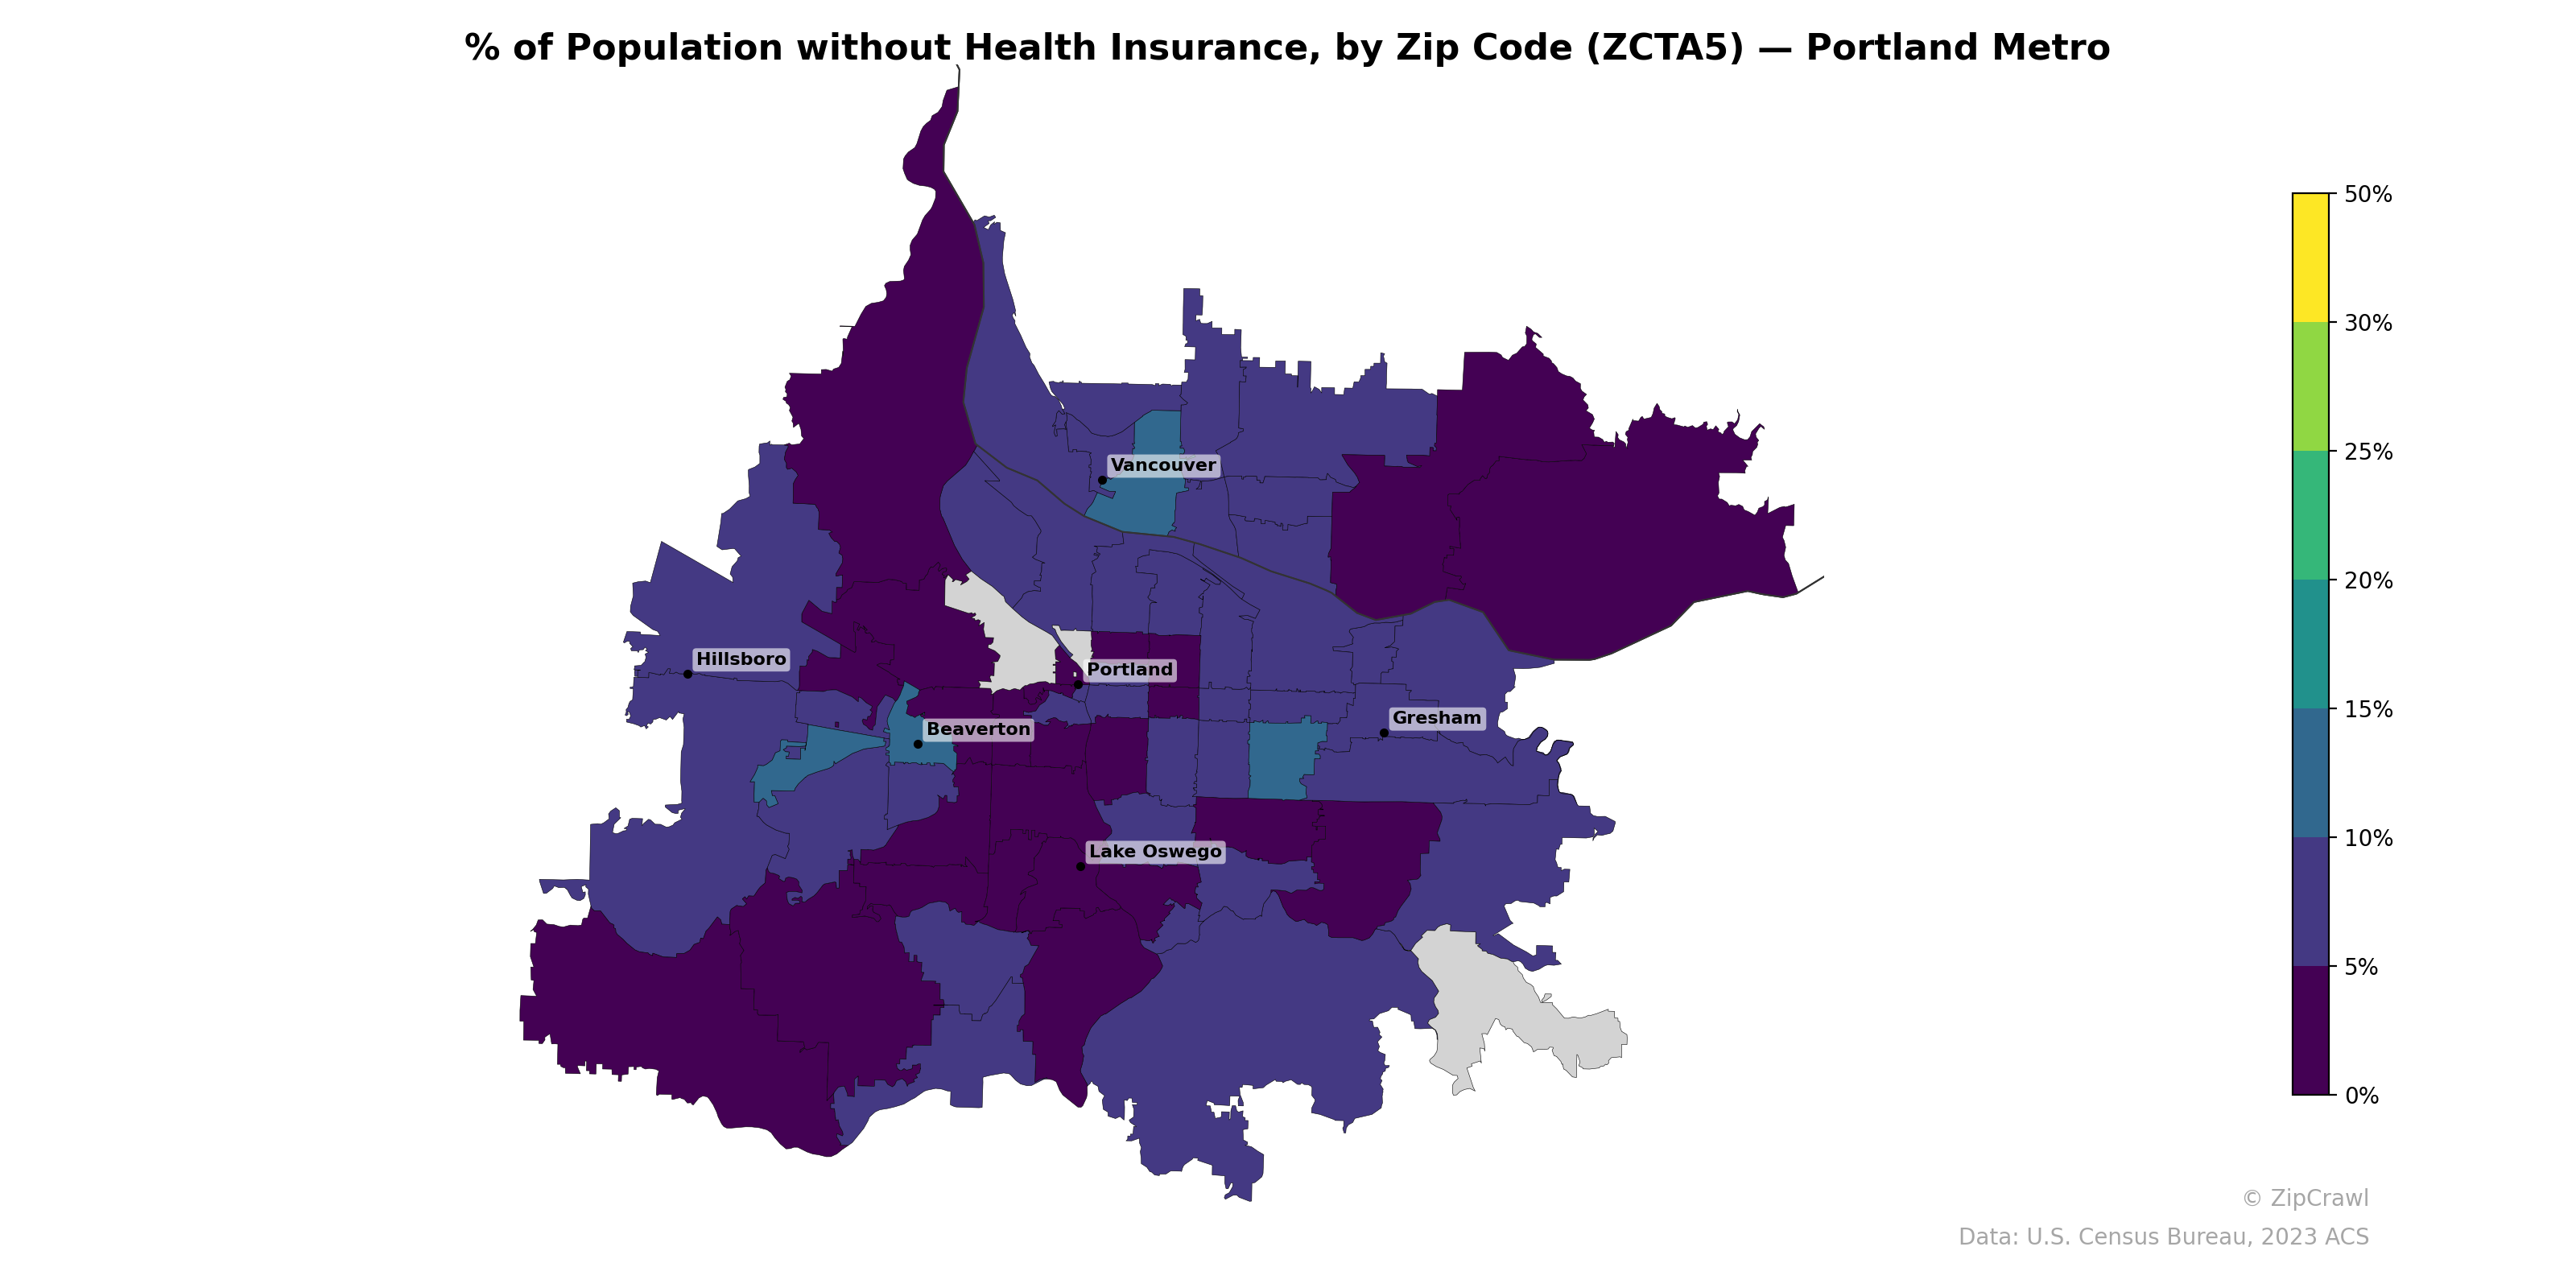
NOTE: Gray indicates insufficient data or a suppressed estimate.
Uninsured rates across the Portland metro area generally remain below 10%, but a distinct cluster of higher uninsurance (approximately 10–15%) emerges in zip codes southeast of downtown Portland extending toward Gresham, as well as in parts of outer southwest and western Hillsboro. The lowest uninsured percentages, near 0–3%, concentrate in Lake Oswego, inner southwest Portland, and several Vancouver-area zip codes north of the Columbia River. A notable contrast exists between the affluent inner-ring suburbs and the outer eastern portions of the metro, where rates roughly triple, suggesting disparities in employer-sponsored coverage or access to marketplace plans.
Data: U.S. Census Bureau, 2023 ACS
Explore
- High School Graduate (% of Over 25) by Zip Code (ZCTA5) — Texas
- Household Average Size by Zip Code (ZCTA5) — Portland Metro
- Housing Owner-Occupied % of Units, by Zip Code (ZCTA5) — Portland Metro
- Housing Owner-Occupied Median Value ($), by Zip Code (ZCTA5) — Portland Metro
- Housing Vacancy Rate by Zip Code (ZCTA5) — Portland Metro
- Bachelor's Degree or Higher (% of Over 25) by Zip Code (ZCTA5) — Portland Metro
- Housing Median Monthly Rent ($), by Zip Code (ZCTA5) — Portland Metro
- % of Households with Broadband Internet, by Zip Code (ZCTA5) — Portland Metro
- Housing % of Units Built Since 2010, by Zip Code (ZCTA5) — Portland Metro
- Married Couple (% of all Households) by Zip Code (ZCTA5) — Portland Metro
- High School Graduate (% of Over 25) by County
- Population Non-Hispanic White % by Zip Code (ZCTA5) — Texas
- U.S. Citizens (% of Population Over 18) by Zip Code (ZCTA5) — Texas
- Household Median Income by Zip Code (ZCTA5) — Texas
- Population Non-Hispanic Asian % by Zip Code (ZCTA5) — Chicago Metro
- Population Non-Hispanic Black % by Zip Code (ZCTA5) — Texas
- Population Hispanic % by Zip Code (ZCTA5) — Texas
- Population Non-Hispanic American Indian % by Zip Code (ZCTA5) — Texas
- Median Age by Zip Code (ZCTA5) — Texas
- % of Population on Food Stamps or SNAP (Last 12 Months), by Zip Code (ZCTA5) — Chicago Metro
- Housing Owner-Occupied % of Units, by Zip Code (ZCTA5) — Baltimore Metro
- % of Households with Broadband Internet, by Zip Code (ZCTA5) — Baltimore Metro
- Housing Owner-Occupied Median Value ($), by Zip Code (ZCTA5) — Baltimore Metro
- % of Population on Food Stamps or SNAP (Last 12 Months), by Zip Code (ZCTA5) — Charlotte Metro
- Population Non-Hispanic Asian % by Zip Code (ZCTA5) — Charlotte Metro
- U.S. Citizens (% of Population Over 18) by Zip Code (ZCTA5) — Baltimore Metro
- High School Graduate (% of Over 25) by Zip Code (ZCTA5) — Baltimore Metro
- Bachelor's Degree or Higher (% of Over 25) by Zip Code (ZCTA5) — Baltimore Metro
- Population Non-Hispanic American Indian % by Zip Code (ZCTA5) — Baltimore Metro
- Population Non-Hispanic Black % by Zip Code (ZCTA5) — Baltimore Metro
- % of Population without Health Insurance, by Zip Code (ZCTA5) — Orlando Metro
- % of Population without Health Insurance, by Zip Code (ZCTA5) — Atlanta Metro
- % of Population without Health Insurance, by Zip Code (ZCTA5) — Miami Metro
- % of Population without Health Insurance, by Zip Code (ZCTA5) — Houston Metro
- % of Population without Health Insurance, by Zip Code (ZCTA5) — Boston Metro
- % of Population without Health Insurance, by Zip Code (ZCTA5) — Detroit Metro
- % of Population without Health Insurance, by Zip Code (ZCTA5) — Tampa Metro
- % of Population without Health Insurance, by Zip Code (ZCTA5) — Chicago Metro
- % of Population without Health Insurance, by Zip Code (ZCTA5) — Denver Metro
- % of Population without Health Insurance, by Zip Code (ZCTA5) — Phoenix Metro