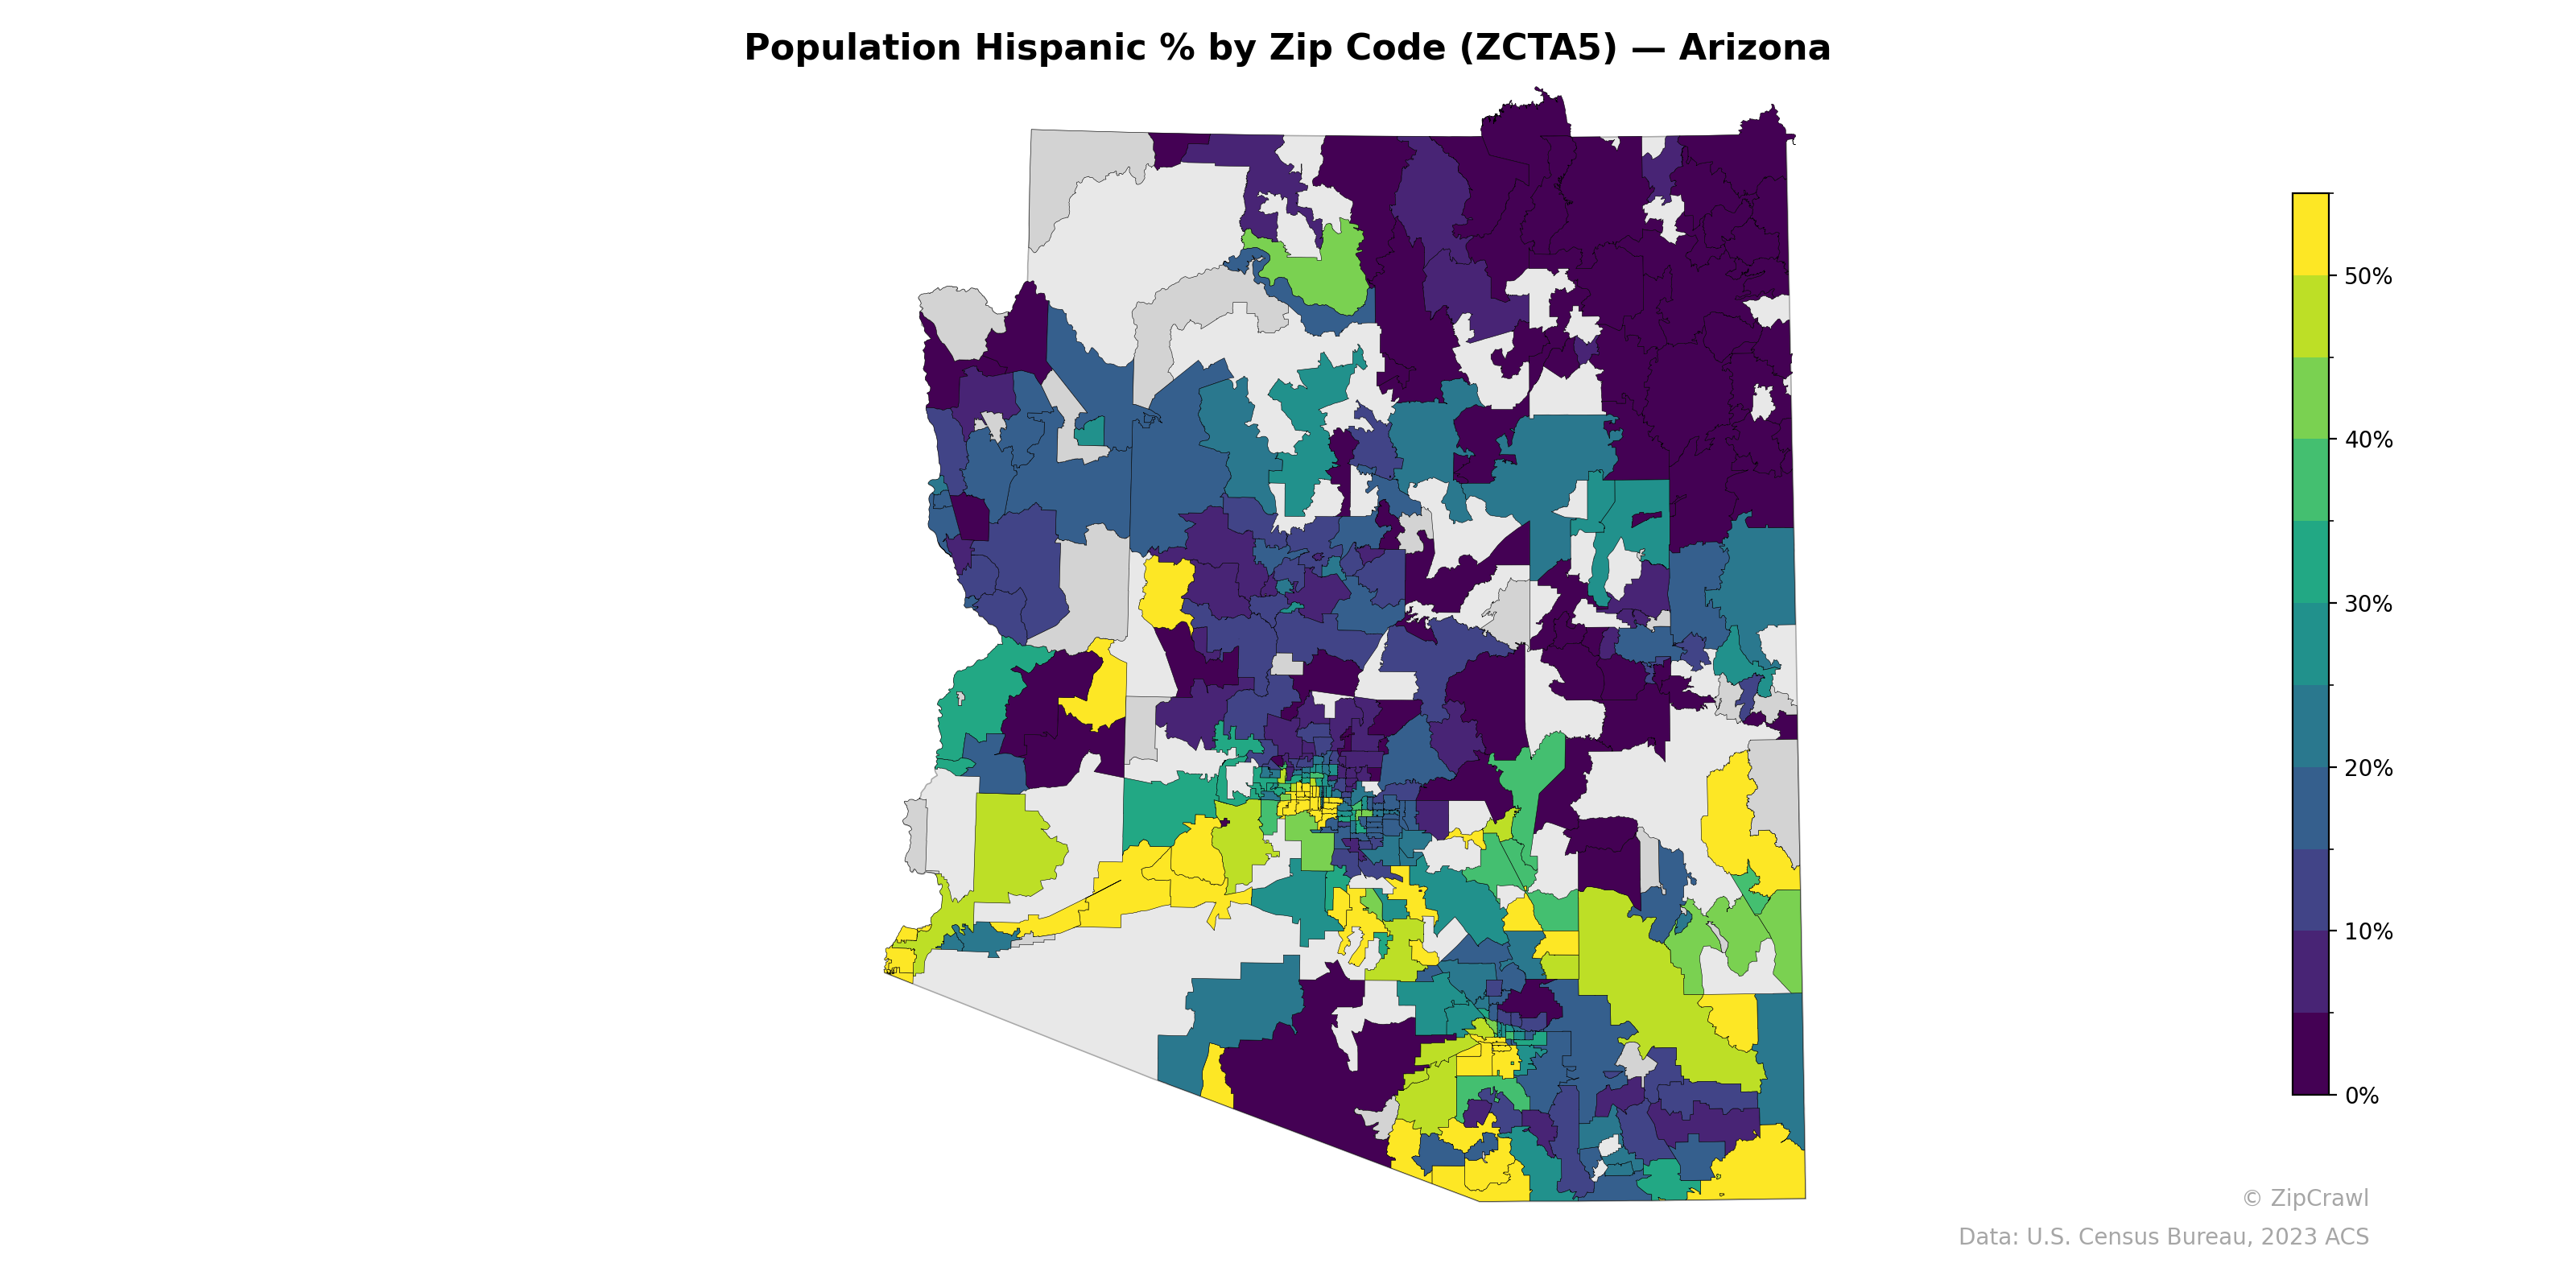
NOTE: Gray indicates insufficient data or a suppressed estimate.
Hispanic population concentrations are highest along Arizona's southern border region and in specific zip codes within the Phoenix metropolitan area, where several zones exceed 50%, likely corresponding to areas such as South Phoenix, Guadalupe, and parts of Tucson's south side. The northeastern portion of the state—encompassing much of the Navajo Nation and Apache County—registers among the lowest Hispanic percentages, typically below 5-10%, reflecting the predominantly Native American demographic composition of those communities. A notable urban-suburban gradient is visible in the Phoenix metro, where central and western zip codes trend significantly more Hispanic than the affluent northeastern corridor stretching through Scottsdale and Fountain Hills.
Data: U.S. Census Bureau, 2023 ACS
Explore
- Population Non-Hispanic American Indian % by Zip Code (ZCTA5) — Los Angeles Metro
- Population Non-Hispanic American Indian % by Zip Code (ZCTA5) — Arizona
- U.S. Citizens (% of Population Over 18) by Zip Code (ZCTA5) — Arizona
- Household Median Income by Zip Code (ZCTA5) — Arizona
- High School Graduate (% of Over 25) by Zip Code (ZCTA5) — Arizona
- % of Population on Food Stamps or SNAP (Last 12 Months), by Zip Code (ZCTA5) — Washington
- Population Non-Hispanic Black % by Zip Code (ZCTA5) — Arizona
- Population Non-Hispanic Asian % by Zip Code (ZCTA5) — Washington
- Population Non-Hispanic White % by Zip Code (ZCTA5) — Arizona
- Median Age by Zip Code (ZCTA5) — Arizona
- Housing Owner-Occupied Median Value ($), by Zip Code (ZCTA5) — Montana
- High School Graduate (% of Over 25) by Zip Code (ZCTA5) — Los Angeles Metro
- Median Age by Zip Code (ZCTA5) — Los Angeles Metro
- Household Median Income by Zip Code (ZCTA5) — Los Angeles Metro
- U.S. Citizens (% of Population Over 18) by Zip Code (ZCTA5) — Los Angeles Metro
- Population Non-Hispanic White % by Zip Code (ZCTA5) — Los Angeles Metro
- Population Non-Hispanic Black % by Zip Code (ZCTA5) — Los Angeles Metro
- % of Population on Food Stamps or SNAP (Last 12 Months), by Zip Code (ZCTA5) — New York Metro
- Population Non-Hispanic Asian % by Zip Code (ZCTA5) — Virginia
- Married Couple (% of all Households) by Zip Code (ZCTA5) — Virginia
- % of Population on Food Stamps or SNAP (Last 12 Months), by Zip Code (ZCTA5) — Virginia
- Housing Owner-Occupied Median Value ($), by Zip Code (ZCTA5) — Virginia
- Bachelor's Degree or Higher (% of Over 25) by Zip Code (ZCTA5) — Virginia
- High School Graduate (% of Over 25) by Zip Code (ZCTA5) — Virginia
- % of Population without Health Insurance, by Zip Code (ZCTA5) — Virginia
- Housing Owner-Occupied % of Units, by Zip Code (ZCTA5) — Virginia
- Housing % of Units Built Since 2010, by Zip Code (ZCTA5) — Virginia
- Household Average Size by Zip Code (ZCTA5) — Virginia
- Housing Vacancy Rate by Zip Code (ZCTA5) — Virginia
- % of Households with Broadband Internet, by Zip Code (ZCTA5) — Virginia
- Population Hispanic % by Zip Code (ZCTA5) — Arkansas
- Population Hispanic % by Zip Code (ZCTA5) — Alaska
- Population Hispanic % by Zip Code (ZCTA5) — Ohio
- Population Hispanic % by Zip Code (ZCTA5) — Iowa
- Population Hispanic % by Zip Code (ZCTA5) — Utah
- Population Hispanic % by Zip Code (ZCTA5) — Indiana
- Population Hispanic % by Zip Code (ZCTA5) — Alabama
- Population Hispanic % by Zip Code (ZCTA5) — Montana
- Population Hispanic % by Zip Code (ZCTA5) — Texas
- Population Hispanic % by Zip Code (ZCTA5) — Hawaii