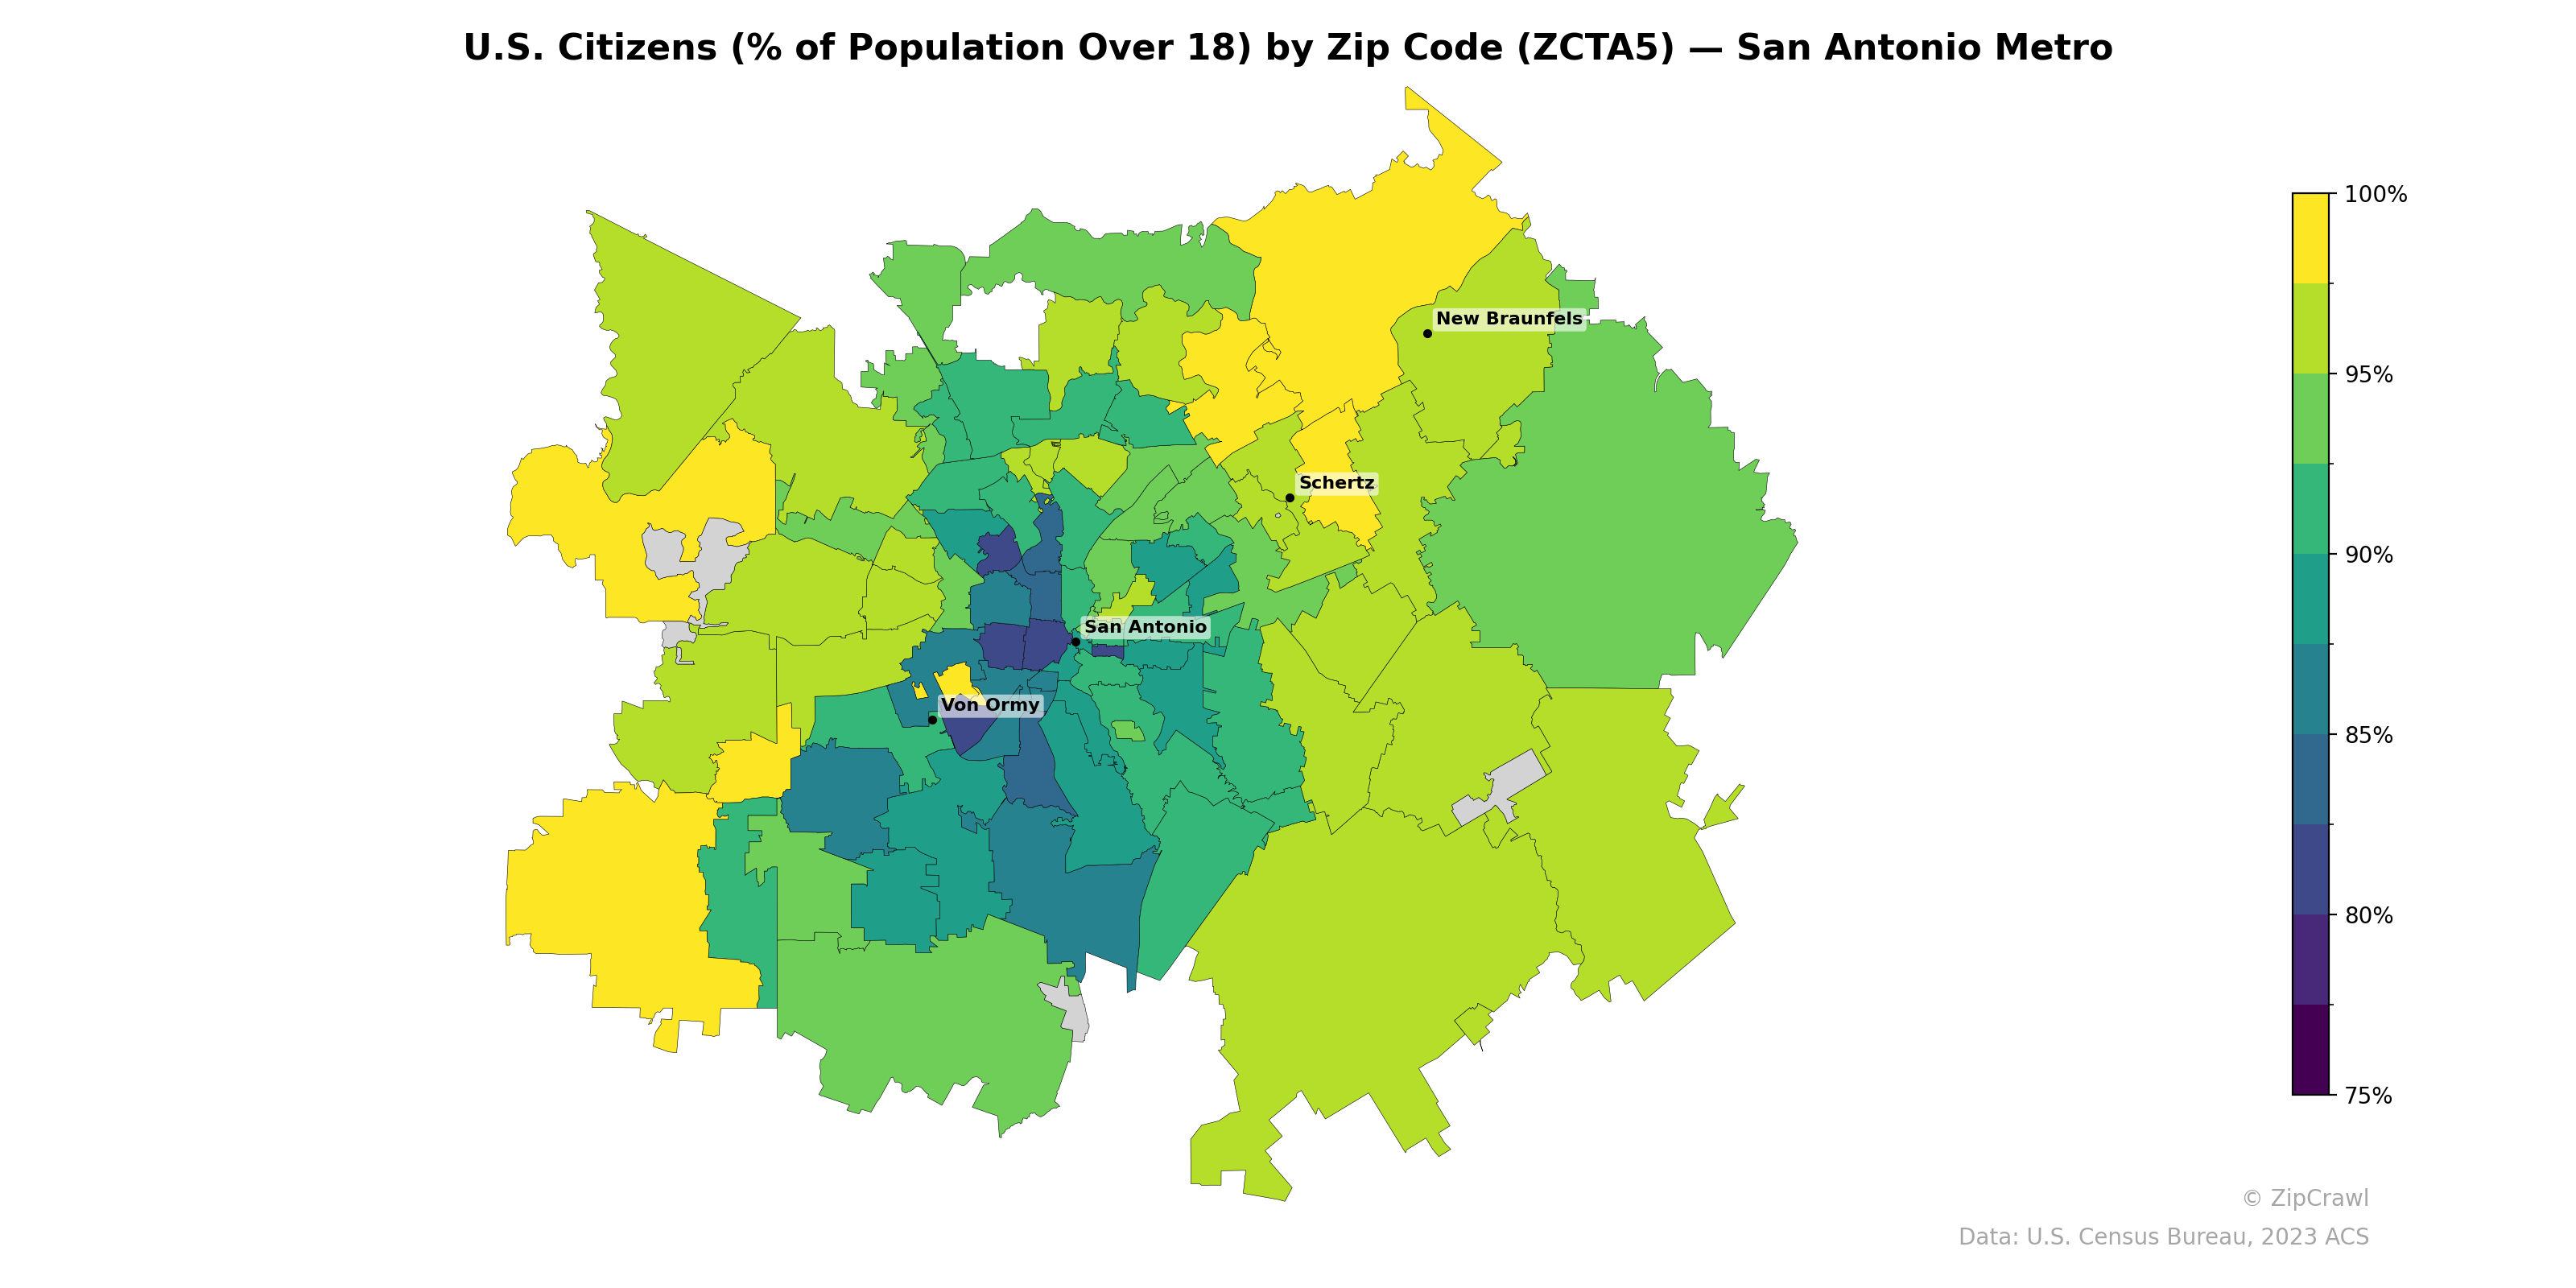
NOTE: Gray indicates insufficient data or a suppressed estimate.
Zip codes in the urban core of San Antonio, particularly south and west of downtown near Von Ormy, display notably lower U.S. citizenship rates among the adult population, falling into the 75–85% range, while peripheral and suburban areas to the north, east, and southeast consistently exceed 90–95%. The highest citizenship percentages cluster in the outer suburban and rural zip codes, including areas near New Braunfels and the far northwest, where rates approach or reach 100%. This core-to-periphery gradient likely reflects the concentration of immigrant communities in central and south-side neighborhoods, contrasting sharply with the predominantly native-born populations in newer suburban developments.
Data: U.S. Census Bureau, 2023 ACS
Explore
- Median Age by Zip Code (ZCTA5) — Texas
- Population Non-Hispanic American Indian % by Zip Code (ZCTA5) — San Antonio Metro
- Median Age by Zip Code (ZCTA5) — San Antonio Metro
- Population Hispanic % by Zip Code (ZCTA5) — San Antonio Metro
- Population Non-Hispanic White % by Zip Code (ZCTA5) — San Antonio Metro
- Population Non-Hispanic Black % by Zip Code (ZCTA5) — San Antonio Metro
- Population Non-Hispanic Asian % by Zip Code (ZCTA5) — St. Louis Metro
- Household Median Income by Zip Code (ZCTA5) — San Antonio Metro
- High School Graduate (% of Over 25) by Zip Code (ZCTA5) — San Antonio Metro
- % of Population on Food Stamps or SNAP (Last 12 Months), by Zip Code (ZCTA5) — St. Louis Metro
- High School Graduate (% of Over 25) by County
- Population Non-Hispanic White % by Zip Code (ZCTA5) — Texas
- % of Population on Food Stamps or SNAP (Last 12 Months), by Zip Code (ZCTA5) — Chicago Metro
- Household Median Income by Zip Code (ZCTA5) — Texas
- Population Non-Hispanic Asian % by Zip Code (ZCTA5) — Chicago Metro
- Population Non-Hispanic Black % by Zip Code (ZCTA5) — Texas
- Population Hispanic % by Zip Code (ZCTA5) — Texas
- Population Non-Hispanic American Indian % by Zip Code (ZCTA5) — Texas
- High School Graduate (% of Over 25) by Zip Code (ZCTA5) — Texas
- Housing Owner-Occupied Median Value ($), by Zip Code (ZCTA5) — Baltimore Metro
- % of Population without Health Insurance, by Zip Code (ZCTA5) — Baltimore Metro
- Housing Median Monthly Rent ($), by Zip Code (ZCTA5) — Baltimore Metro
- % of Population on Food Stamps or SNAP (Last 12 Months), by Zip Code (ZCTA5) — Charlotte Metro
- High School Graduate (% of Over 25) by Zip Code (ZCTA5) — Baltimore Metro
- Population Non-Hispanic Asian % by Zip Code (ZCTA5) — Baltimore Metro
- Household Median Income by Zip Code (ZCTA5) — Baltimore Metro
- Population Non-Hispanic American Indian % by Zip Code (ZCTA5) — Baltimore Metro
- % of Households with Broadband Internet, by Zip Code (ZCTA5) — Baltimore Metro
- Housing Owner-Occupied % of Units, by Zip Code (ZCTA5) — Baltimore Metro
- Population Non-Hispanic Asian % by Zip Code (ZCTA5) — Charlotte Metro
- U.S. Citizens (% of Population Over 18) by Zip Code (ZCTA5) — San Diego Metro
- U.S. Citizens (% of Population Over 18) by Zip Code (ZCTA5) — Boston Metro
- U.S. Citizens (% of Population Over 18) by Zip Code (ZCTA5) — Atlanta Metro
- U.S. Citizens (% of Population Over 18) by Zip Code (ZCTA5) — Houston Metro
- U.S. Citizens (% of Population Over 18) by Zip Code (ZCTA5) — Austin Metro
- U.S. Citizens (% of Population Over 18) by Zip Code (ZCTA5) — Miami Metro
- U.S. Citizens (% of Population Over 18) by Zip Code (ZCTA5) — Denver Metro
- U.S. Citizens (% of Population Over 18) by Zip Code (ZCTA5) — Detroit Metro
- U.S. Citizens (% of Population Over 18) by Zip Code (ZCTA5) — Tampa Metro
- U.S. Citizens (% of Population Over 18) by Zip Code (ZCTA5) — San Francisco Metro