NOTE: Gray indicates insufficient data or a suppressed estimate.
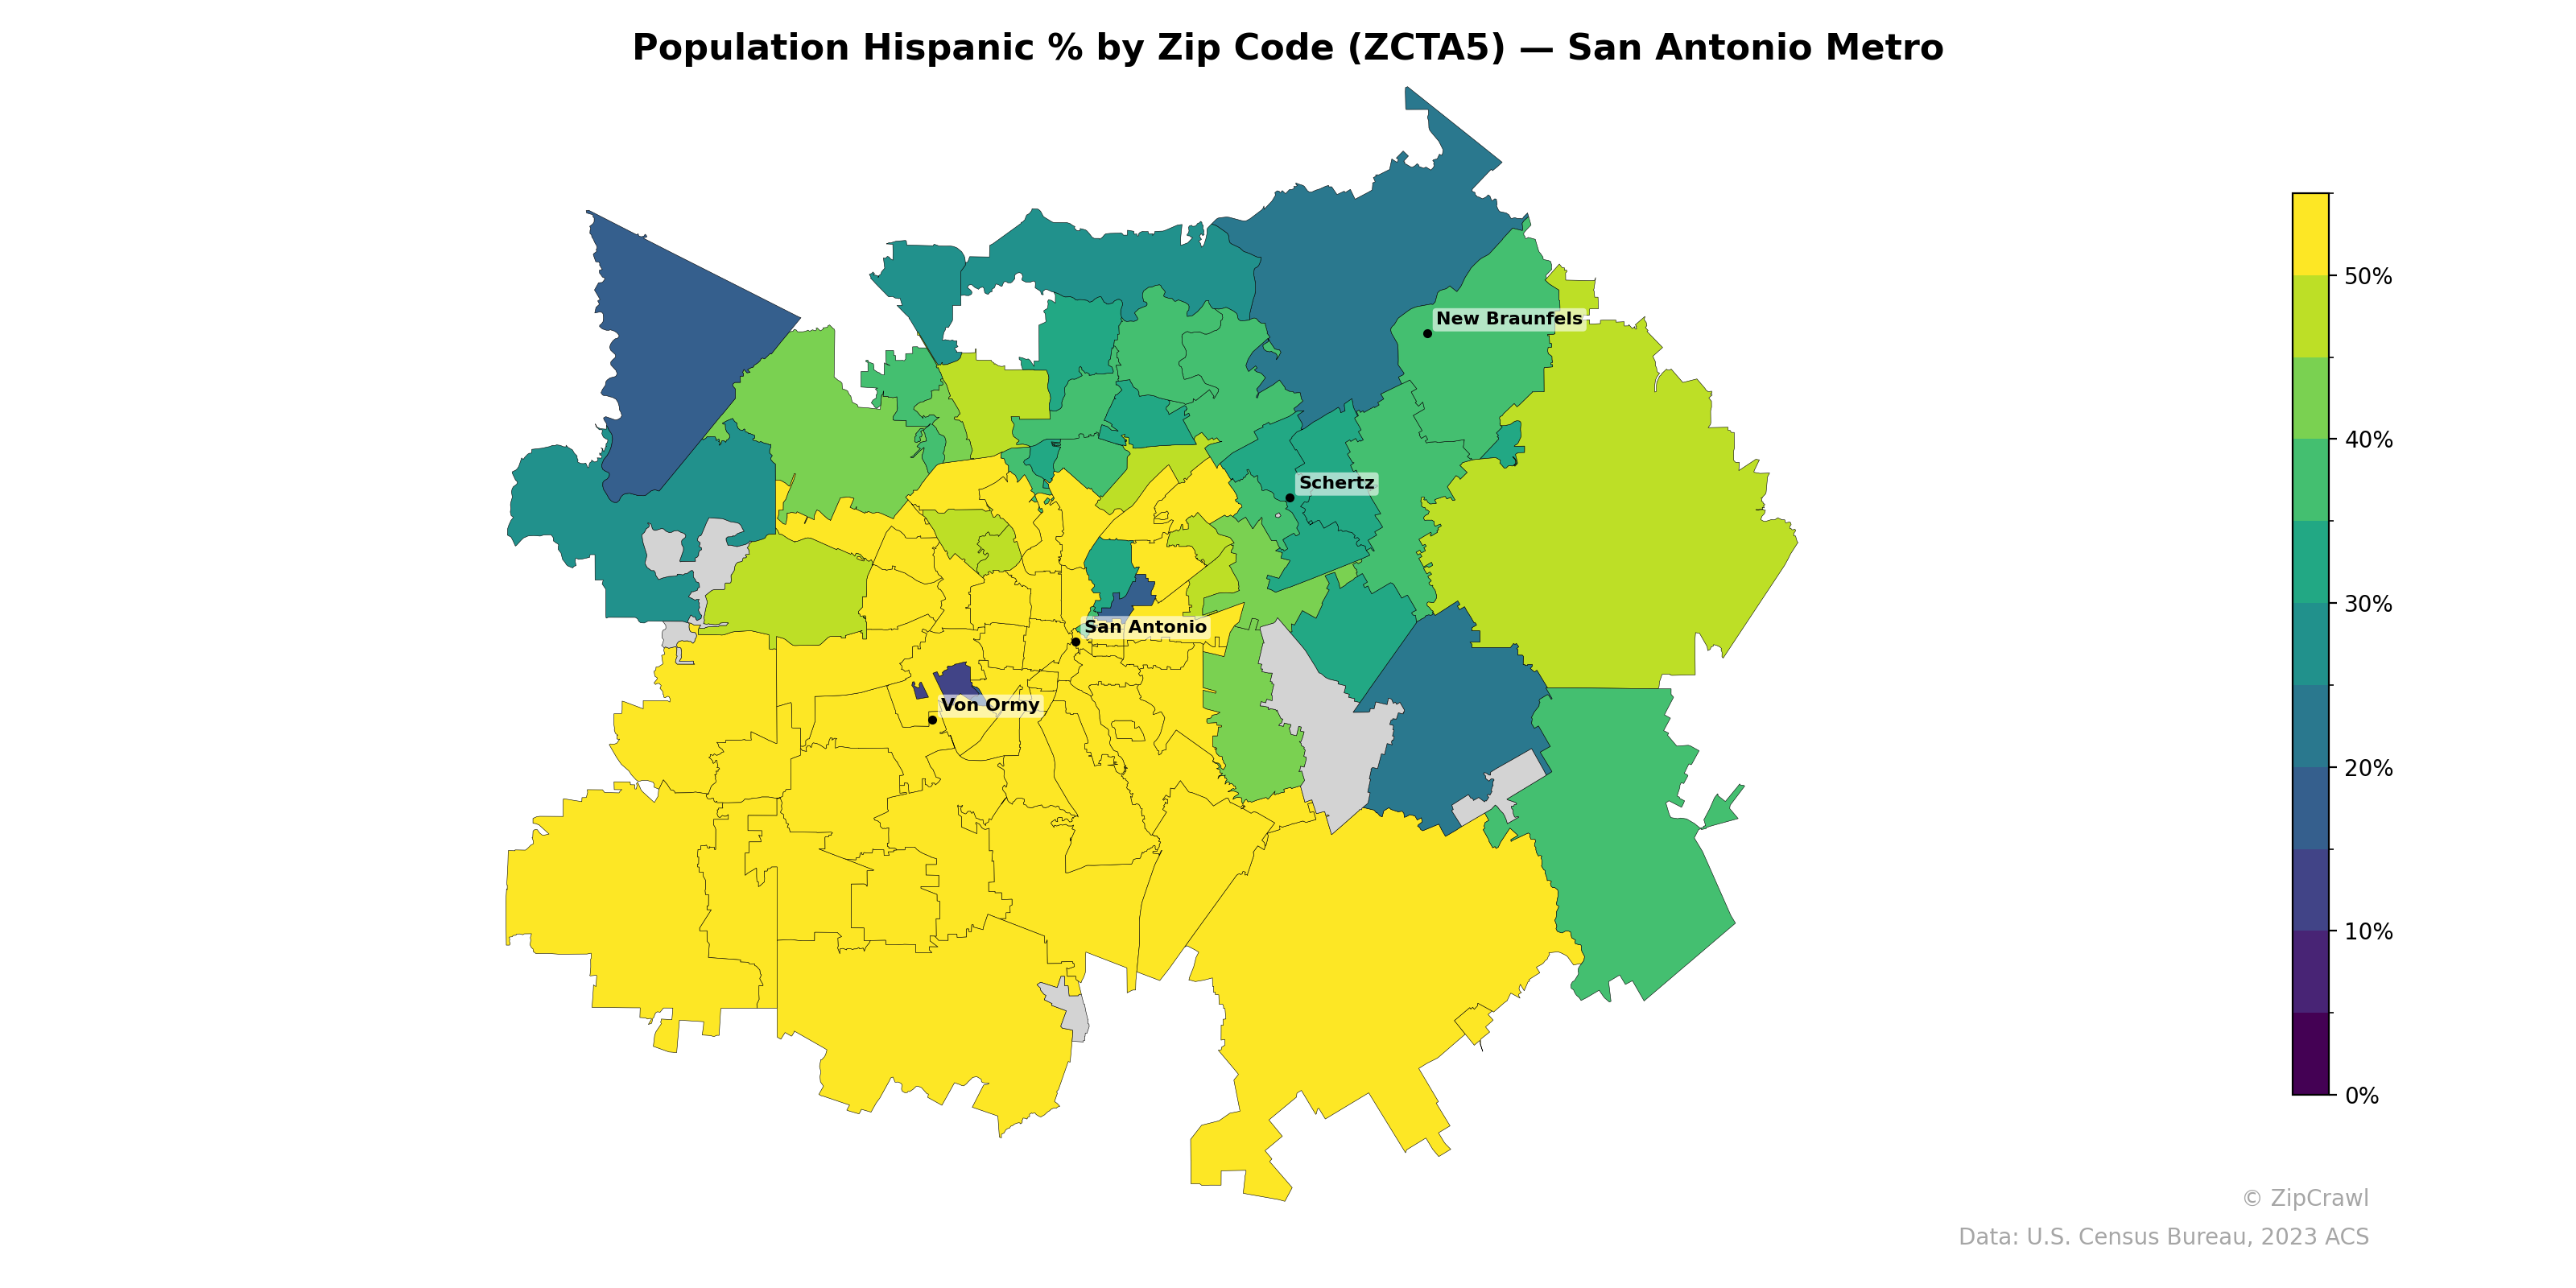
The southern and western portions of the San Antonio metro exhibit the highest Hispanic population shares, frequently exceeding 50%, with particularly intense concentrations in zip codes south of downtown and extending toward Von Ormy. A stark gradient emerges moving northward and northeast, where areas around New Braunfels and the far northeastern exurbs drop to 20–30% Hispanic, reflecting the metro's well-documented demographic divide along a southwest-to-northeast axis. The Schertz corridor and several zip codes east of downtown represent a transitional zone, generally falling in the 30–40% range.
Data: U.S. Census Bureau, 2023 ACS
Explore
- Median Age by Zip Code (ZCTA5) — Texas
- High School Graduate (% of Over 25) by Zip Code (ZCTA5) — San Antonio Metro
- Population Non-Hispanic Black % by Zip Code (ZCTA5) — San Antonio Metro
- U.S. Citizens (% of Population Over 18) by Zip Code (ZCTA5) — San Antonio Metro
- Population Non-Hispanic Asian % by Zip Code (ZCTA5) — St. Louis Metro
- Household Median Income by Zip Code (ZCTA5) — San Antonio Metro
- Population Non-Hispanic White % by Zip Code (ZCTA5) — San Antonio Metro
- % of Population on Food Stamps or SNAP (Last 12 Months), by Zip Code (ZCTA5) — St. Louis Metro
- Median Age by Zip Code (ZCTA5) — San Antonio Metro
- Population Non-Hispanic American Indian % by Zip Code (ZCTA5) — San Antonio Metro
- High School Graduate (% of Over 25) by County
- Population Non-Hispanic White % by Zip Code (ZCTA5) — Texas
- U.S. Citizens (% of Population Over 18) by Zip Code (ZCTA5) — Texas
- Population Non-Hispanic Asian % by Zip Code (ZCTA5) — Chicago Metro
- Population Non-Hispanic American Indian % by Zip Code (ZCTA5) — Texas
- Household Median Income by Zip Code (ZCTA5) — Texas
- Population Non-Hispanic Black % by Zip Code (ZCTA5) — Texas
- High School Graduate (% of Over 25) by Zip Code (ZCTA5) — Texas
- % of Population on Food Stamps or SNAP (Last 12 Months), by Zip Code (ZCTA5) — Chicago Metro
- Housing Owner-Occupied Median Value ($), by Zip Code (ZCTA5) — Baltimore Metro
- % of Population without Health Insurance, by Zip Code (ZCTA5) — Baltimore Metro
- Housing Median Monthly Rent ($), by Zip Code (ZCTA5) — Baltimore Metro
- Household Median Income by Zip Code (ZCTA5) — Baltimore Metro
- Bachelor's Degree or Higher (% of Over 25) by Zip Code (ZCTA5) — Baltimore Metro
- % of Population on Food Stamps or SNAP (Last 12 Months), by Zip Code (ZCTA5) — Charlotte Metro
- High School Graduate (% of Over 25) by Zip Code (ZCTA5) — Baltimore Metro
- Population Non-Hispanic Asian % by Zip Code (ZCTA5) — Charlotte Metro
- U.S. Citizens (% of Population Over 18) by Zip Code (ZCTA5) — Baltimore Metro
- Housing Owner-Occupied % of Units, by Zip Code (ZCTA5) — Baltimore Metro
- % of Households with Broadband Internet, by Zip Code (ZCTA5) — Baltimore Metro
- Population Hispanic % by Zip Code (ZCTA5) — San Diego Metro
- Population Hispanic % by Zip Code (ZCTA5) — Boston Metro
- Population Hispanic % by Zip Code (ZCTA5) — Atlanta Metro
- Population Hispanic % by Zip Code (ZCTA5) — Houston Metro
- Population Hispanic % by Zip Code (ZCTA5) — San Francisco Metro
- Population Hispanic % by Zip Code (ZCTA5) — Austin Metro
- Population Hispanic % by Zip Code (ZCTA5) — Miami Metro
- Population Hispanic % by Zip Code (ZCTA5) — Seattle Metro
- Population Hispanic % by Zip Code (ZCTA5) — Tampa Metro
- Population Hispanic % by Zip Code (ZCTA5) — Detroit Metro