NOTE: Gray indicates insufficient data or a suppressed estimate.
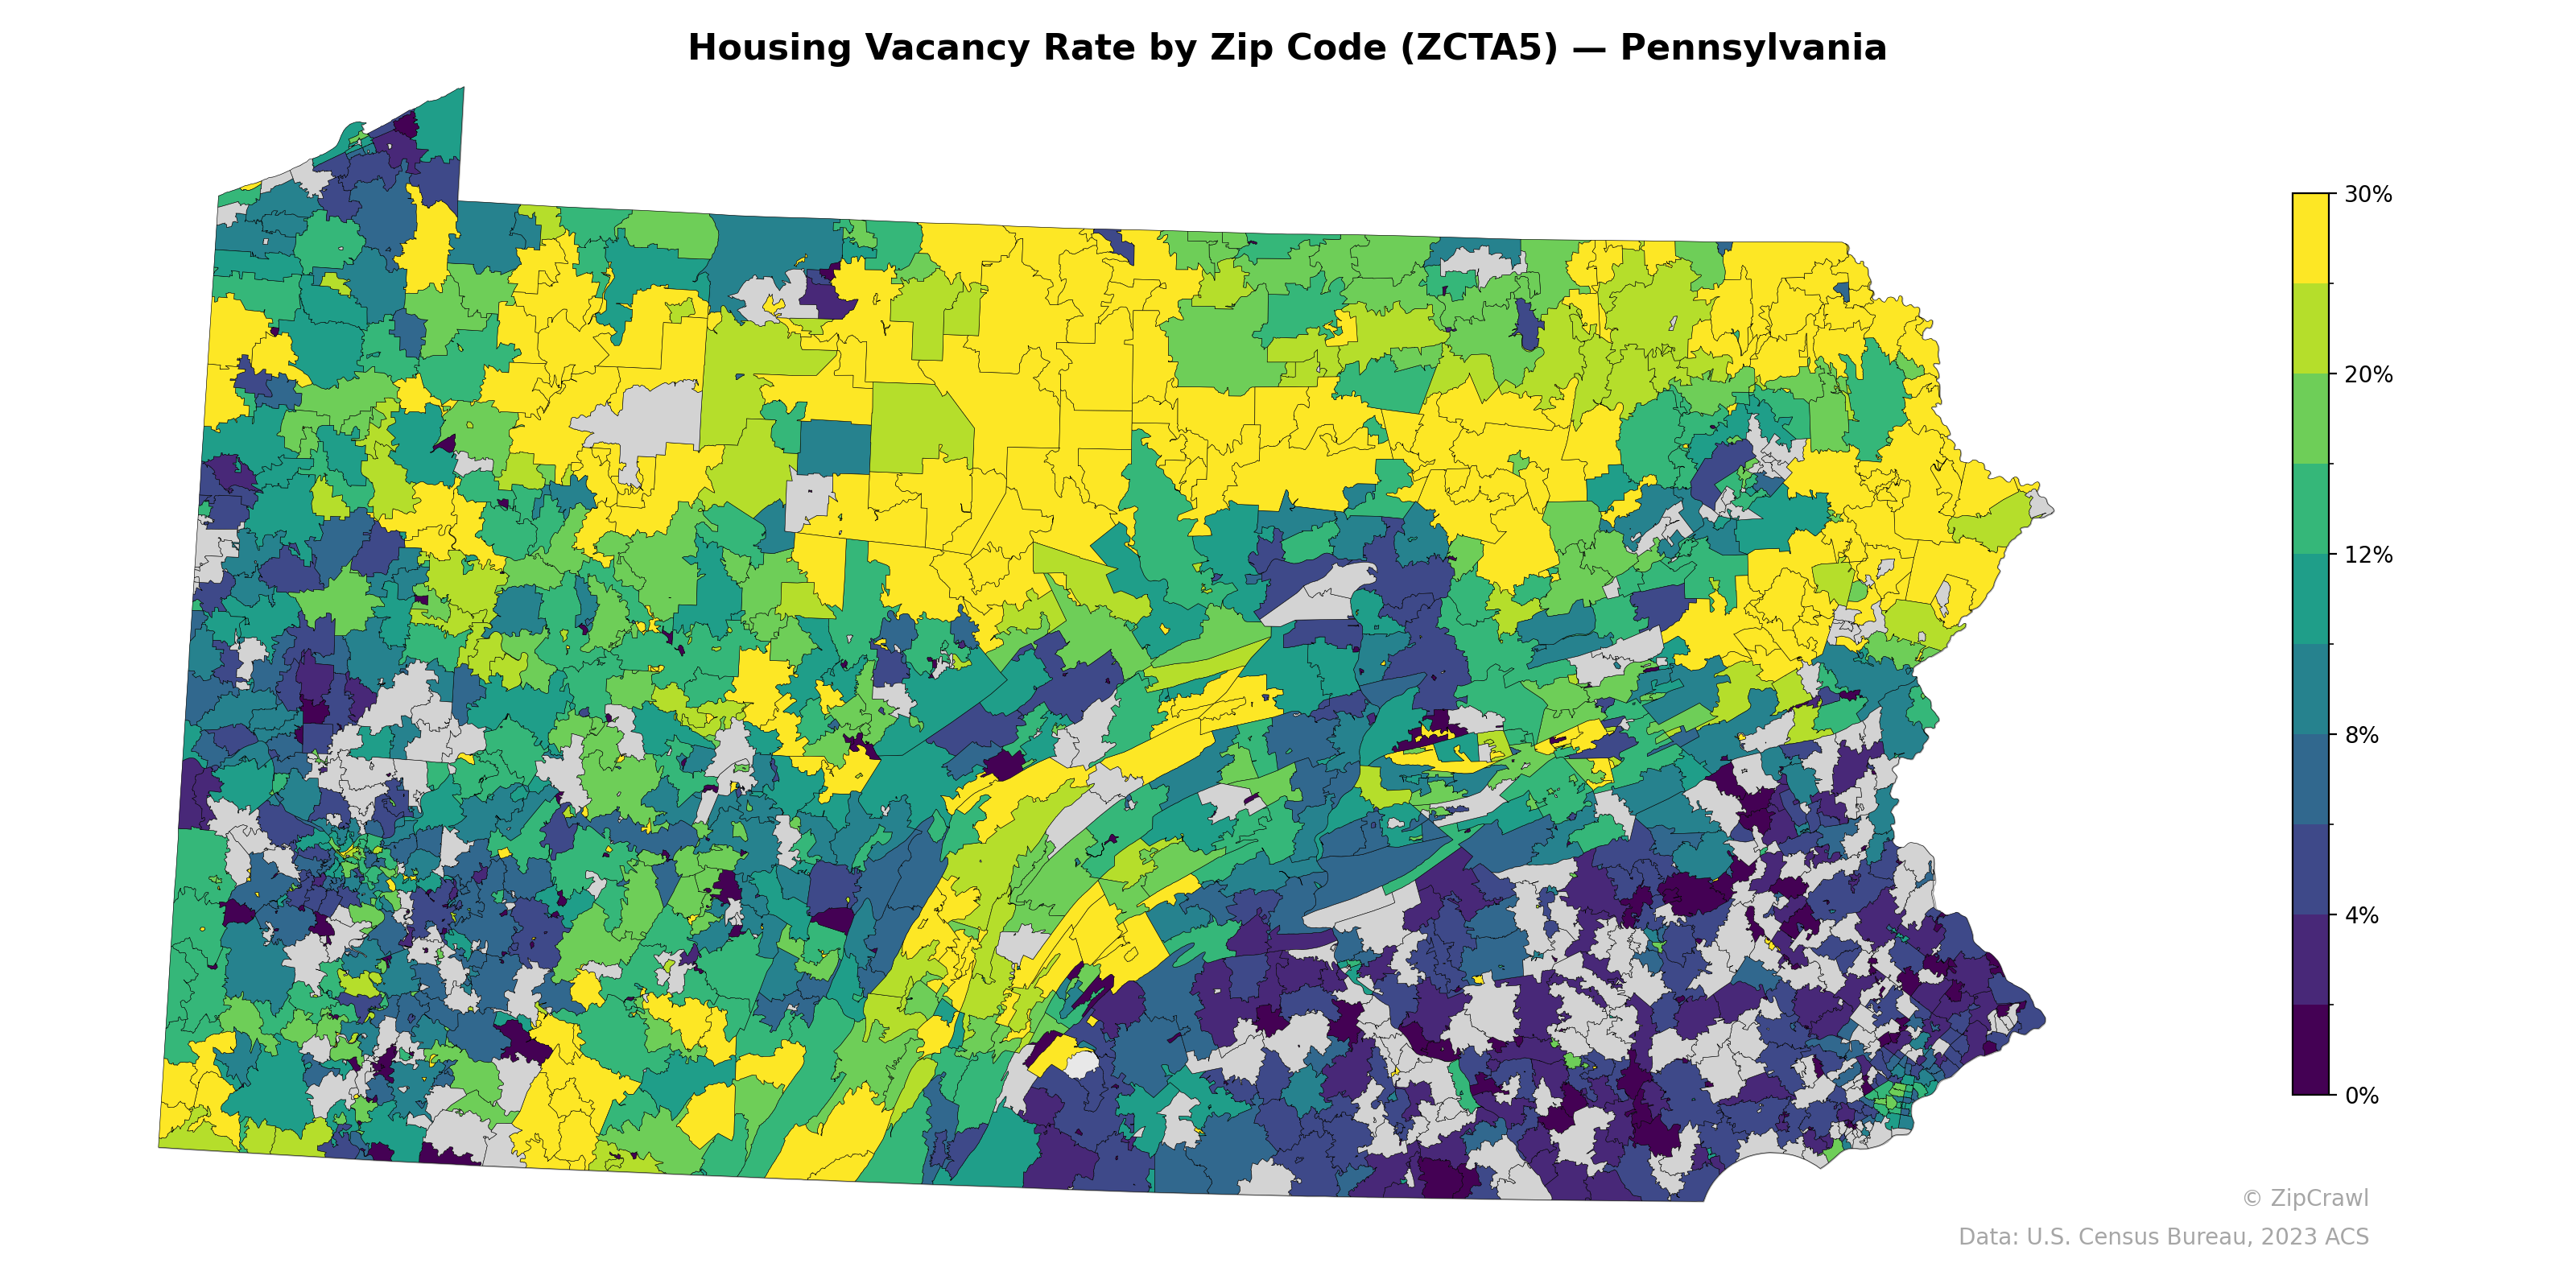
The Philadelphia metropolitan area in the southeast and Pittsburgh region in the southwest exhibit notably low vacancy rates, generally below 4%, consistent with sustained housing demand in Pennsylvania's two largest urban cores. In contrast, the north-central tier and Pocono Mountain regions display persistently elevated vacancy rates exceeding 20-30%, likely reflecting concentrations of seasonal and recreational housing stock. A distinct band of higher vacancy also traces the ridge-and-valley corridor through central Pennsylvania, while suburban collar counties surrounding Philadelphia — including Chester, Montgomery, and Bucks — maintain some of the tightest housing markets in the state.
Data: U.S. Census Bureau, 2023 ACS
Explore
- Population Non-Hispanic Black % by Zip Code (ZCTA5) — Connecticut
- Housing Owner-Occupied Median Value ($), by Zip Code (ZCTA5) — Pennsylvania
- Married Couple (% of all Households) by Zip Code (ZCTA5) — Pennsylvania
- Housing % of Units Built Since 2010, by Zip Code (ZCTA5) — Pennsylvania
- Bachelor's Degree or Higher (% of Over 25) by Zip Code (ZCTA5) — Pennsylvania
- % of Population without Health Insurance, by Zip Code (ZCTA5) — Pennsylvania
- Housing Owner-Occupied % of Units, by Zip Code (ZCTA5) — Pennsylvania
- % of Households with Broadband Internet, by Zip Code (ZCTA5) — Pennsylvania
- Household Average Size by Zip Code (ZCTA5) — Pennsylvania
- Housing Median Monthly Rent ($), by Zip Code (ZCTA5) — Pennsylvania
- Population Non-Hispanic Black % by Zip Code (ZCTA5) — West Virginia
- Population Non-Hispanic Black % by Zip Code (ZCTA5) — Rhode Island
- Population Non-Hispanic Black % by Zip Code (ZCTA5) — Vermont
- Population Non-Hispanic Black % by Zip Code (ZCTA5) — Mississippi
- Household Median Income by County
- U.S. Citizens by County (% of Population Over 18)
- Household Average Size by County
- Housing Median Monthly Rent ($), by County
- Housing Owner-Occupied Median Value ($), by County
- Housing Owner-Occupied % of Units, by County
- % of Households with Broadband Internet, by County
- Housing % of Units Built Since 2010, by County
- Population Non-Hispanic Asian % by County
- Married Couple (% of all Households) by County
- Housing Owner-Occupied % of Units, by Zip Code (ZCTA5) — California
- Bachelor's Degree or Higher (% of Over 25) by Zip Code (ZCTA5) — California
- % of Population without Health Insurance, by Zip Code (ZCTA5) — California
- Housing Owner-Occupied Median Value ($), by Zip Code (ZCTA5) — California
- Population Non-Hispanic American Indian % by Zip Code (ZCTA5) — California
- High School Graduate (% of Over 25) by Zip Code (ZCTA5) — California
- Housing Vacancy Rate by Zip Code (ZCTA5) — Virginia
- Housing Vacancy Rate by Zip Code (ZCTA5) — Utah
- Housing Vacancy Rate by Zip Code (ZCTA5) — Iowa
- Housing Vacancy Rate by Zip Code (ZCTA5) — Ohio
- Housing Vacancy Rate by Zip Code (ZCTA5) — California
- Housing Vacancy Rate by Zip Code (ZCTA5) — Georgia
- Housing Vacancy Rate by Zip Code (ZCTA5) — Idaho
- Housing Vacancy Rate by Zip Code (ZCTA5) — Texas
- Housing Vacancy Rate by Zip Code (ZCTA5) — Hawaii
- Housing Vacancy Rate by Zip Code (ZCTA5) — Maine