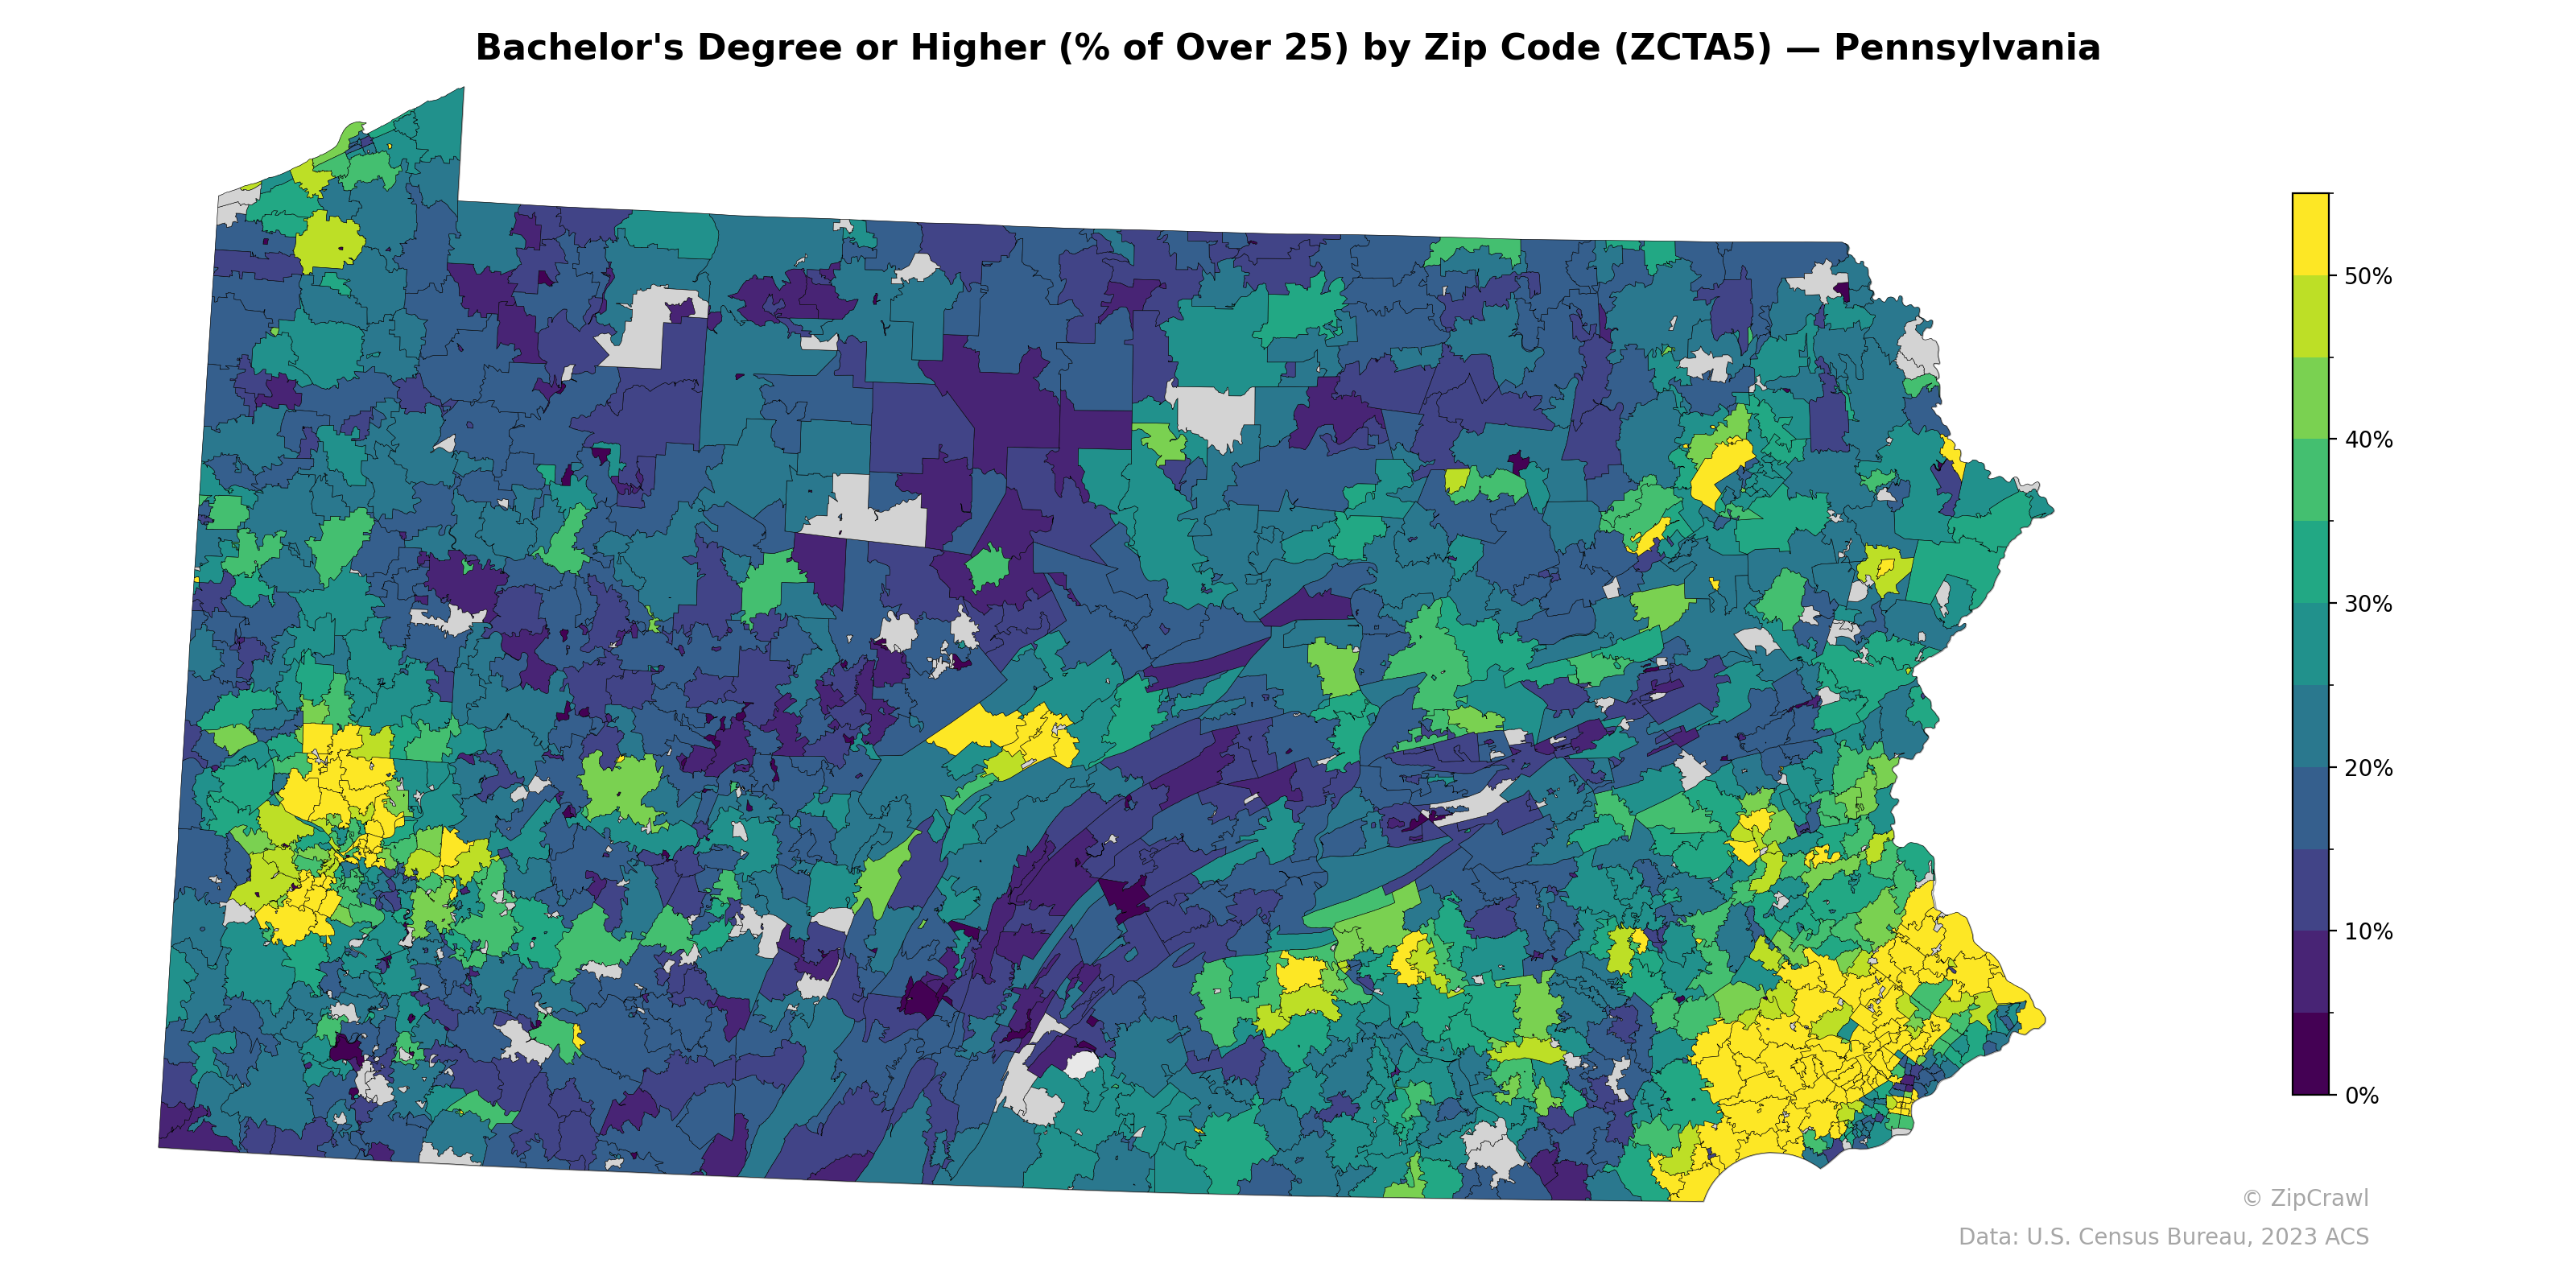
NOTE: Gray indicates insufficient data or a suppressed estimate.
The Philadelphia suburban collar counties—particularly Chester, Montgomery, and Bucks—display consistently high bachelor's attainment rates exceeding 50%, forming the state's most prominent cluster of highly educated zip codes, with a secondary concentration visible around Pittsburgh's eastern suburbs in Allegheny County. Central Pennsylvania's rural zip codes, spanning the ridge-and-valley region from Blair to Schuylkill counties, exhibit notably lower attainment rates predominantly in the 10–20% range, punctuated by isolated pockets of higher education near college towns such as State College and Lewisburg. The contrast between the southeast corner and the northern tier is stark, with much of the state's rural north showing attainment rates below 20% while the Philadelphia metro area sustains rates two to three times higher.
Data: U.S. Census Bureau, 2023 ACS
Explore
- Married Couple (% of all Households) by Zip Code (ZCTA5) — Oklahoma
- Housing Vacancy Rate by County
- Housing Owner-Occupied % of Units, by Zip Code (ZCTA5) — Pennsylvania
- Housing Median Monthly Rent ($), by Zip Code (ZCTA5) — Pennsylvania
- Housing Vacancy Rate by Zip Code (ZCTA5) — Pennsylvania
- Housing Owner-Occupied Median Value ($), by Zip Code (ZCTA5) — Pennsylvania
- % of Population without Health Insurance, by Zip Code (ZCTA5) — Pennsylvania
- % of Households with Broadband Internet, by Zip Code (ZCTA5) — Pennsylvania
- Household Average Size by Zip Code (ZCTA5) — Pennsylvania
- Housing % of Units Built Since 2010, by Zip Code (ZCTA5) — Pennsylvania
- Married Couple (% of all Households) by Zip Code (ZCTA5) — Pennsylvania
- Married Couple (% of all Households) by Zip Code (ZCTA5) — Alaska
- Married Couple (% of all Households) by Zip Code (ZCTA5) — Arkansas
- Married Couple (% of all Households) by Zip Code (ZCTA5) — Montana
- Married Couple (% of all Households) by Zip Code (ZCTA5) — Idaho
- Household Median Income by County
- Married Couple (% of all Households) by County
- Household Average Size by County
- U.S. Citizens by County (% of Population Over 18)
- Housing Median Monthly Rent ($), by County
- Housing Owner-Occupied Median Value ($), by County
- Housing Owner-Occupied % of Units, by County
- % of Households with Broadband Internet, by County
- Housing % of Units Built Since 2010, by County
- Population Non-Hispanic Asian % by County
- Housing Owner-Occupied Median Value ($), by Zip Code (ZCTA5) — California
- % of Population without Health Insurance, by Zip Code (ZCTA5) — California
- Housing Owner-Occupied % of Units, by Zip Code (ZCTA5) — California
- Housing % of Units Built Since 2010, by Zip Code (ZCTA5) — California
- Population Non-Hispanic American Indian % by Zip Code (ZCTA5) — California
- Bachelor's Degree or Higher (% of Over 25) by Zip Code (ZCTA5) — Ohio
- Bachelor's Degree or Higher (% of Over 25) by Zip Code (ZCTA5) — Virginia
- Bachelor's Degree or Higher (% of Over 25) by Zip Code (ZCTA5) — Oregon
- Bachelor's Degree or Higher (% of Over 25) by Zip Code (ZCTA5) — Iowa
- Bachelor's Degree or Higher (% of Over 25) by Zip Code (ZCTA5) — Utah
- Bachelor's Degree or Higher (% of Over 25) by Zip Code (ZCTA5) — California
- Bachelor's Degree or Higher (% of Over 25) by Zip Code (ZCTA5) — Georgia
- Bachelor's Degree or Higher (% of Over 25) by Zip Code (ZCTA5) — Colorado
- Bachelor's Degree or Higher (% of Over 25) by Zip Code (ZCTA5) — Texas
- Bachelor's Degree or Higher (% of Over 25) by Zip Code (ZCTA5) — Idaho