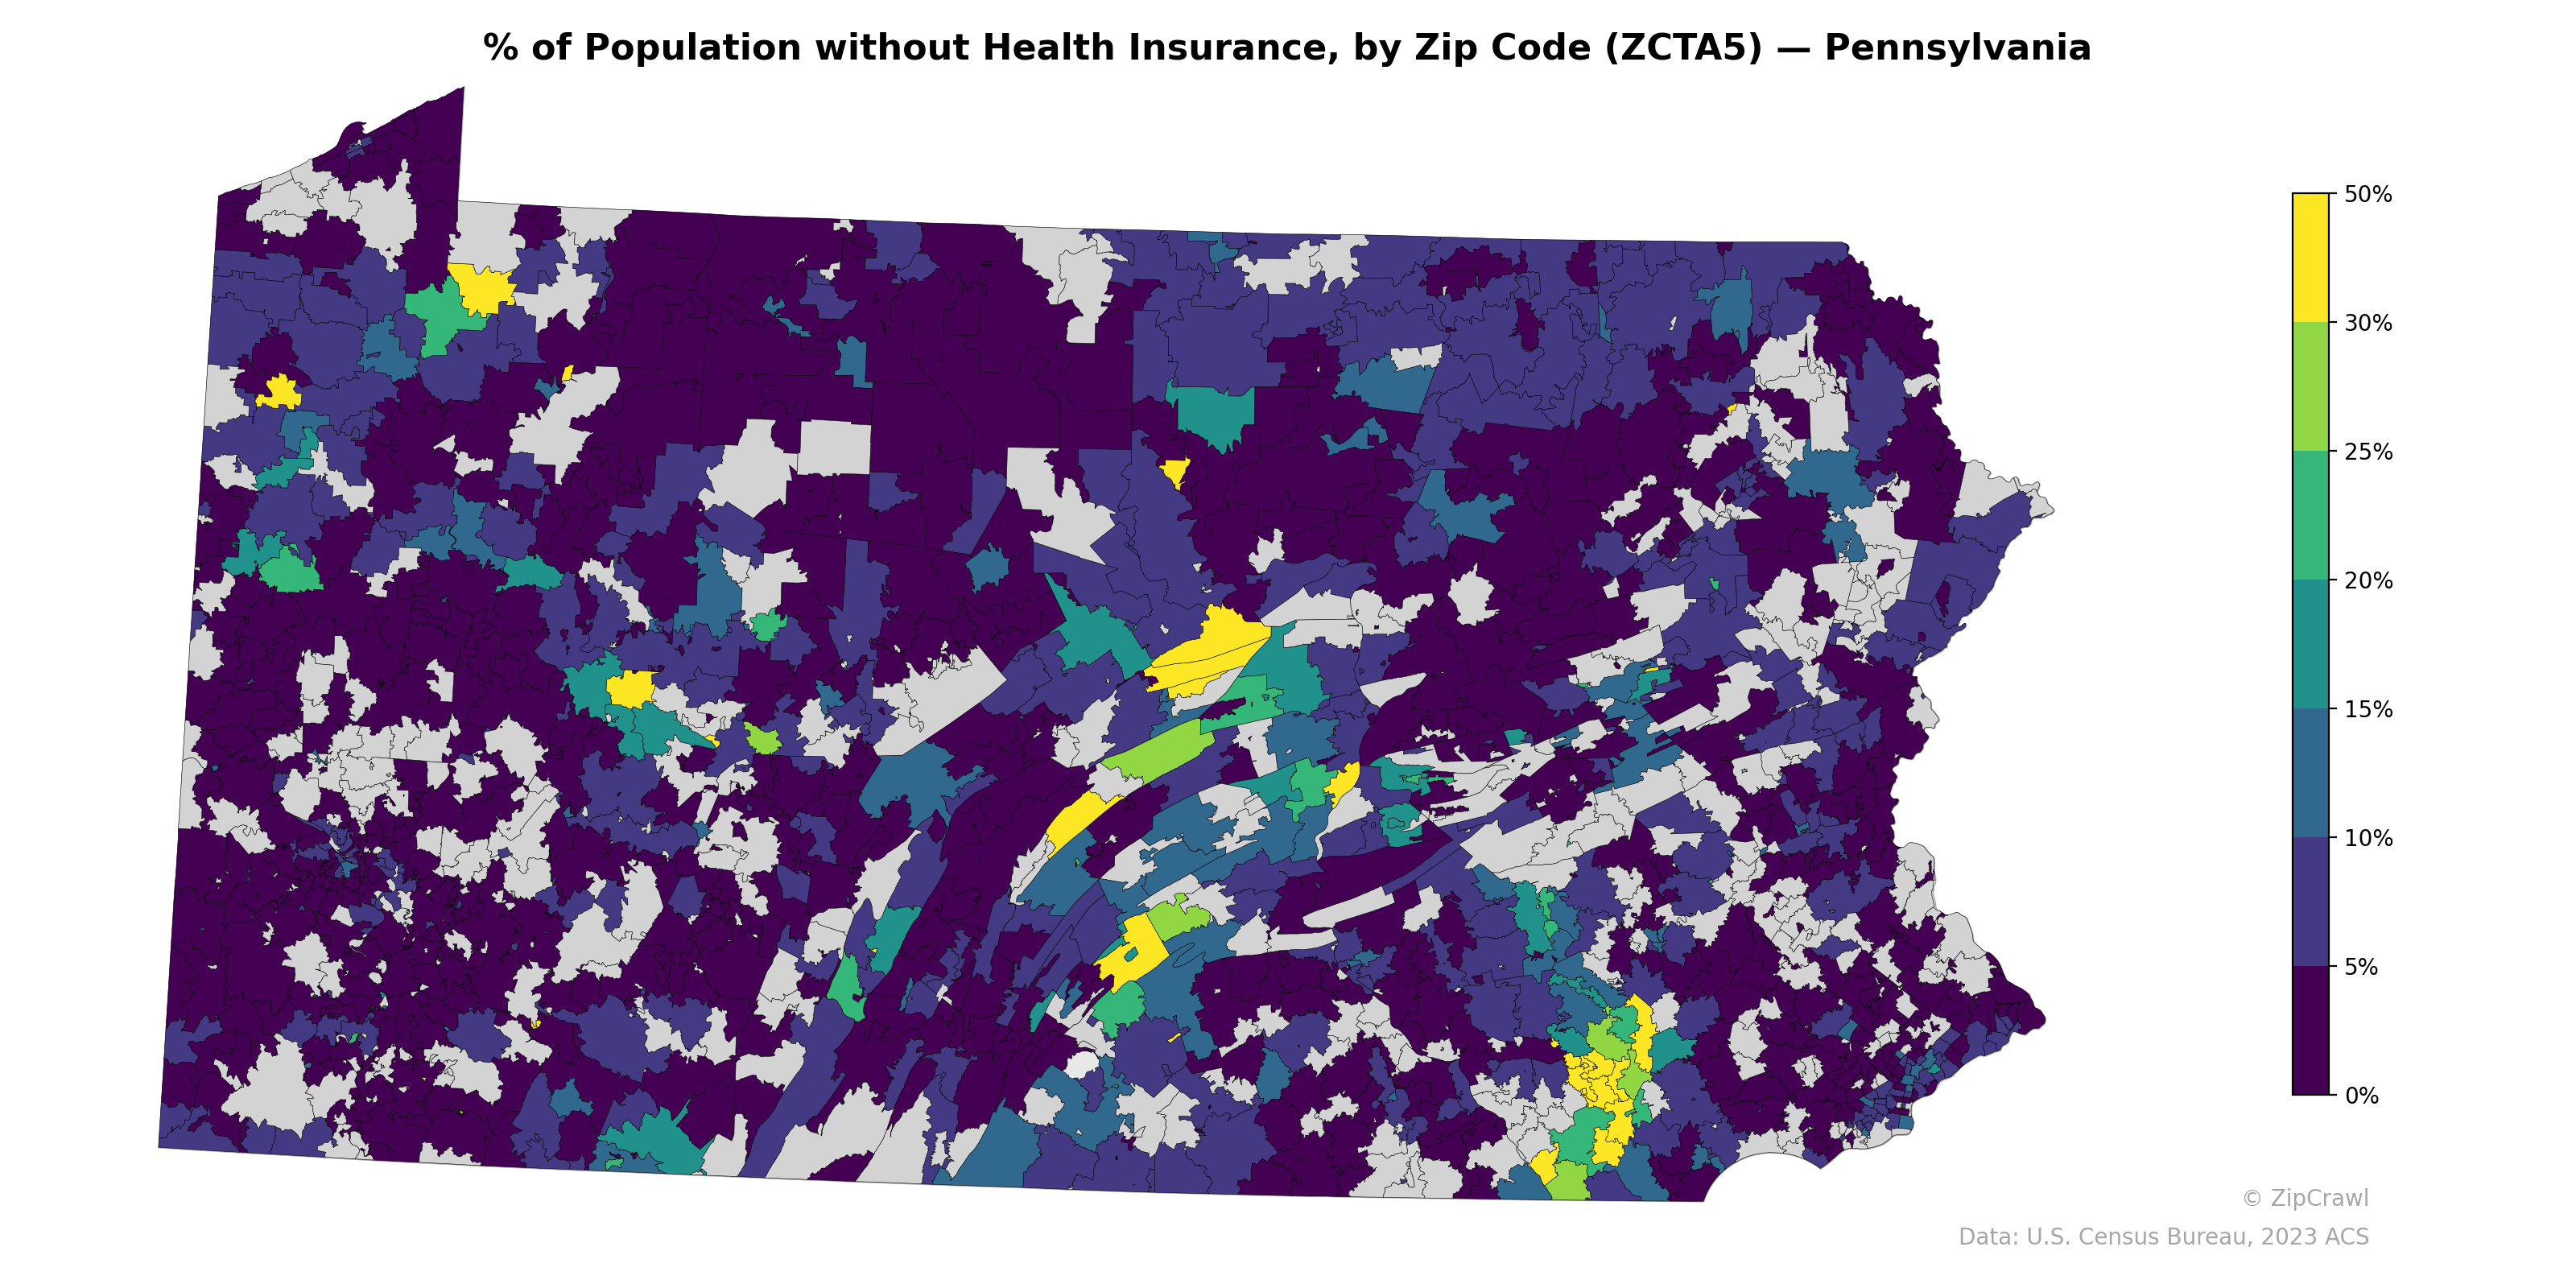
NOTE: Gray indicates insufficient data or a suppressed estimate.
Uninsured rates across Pennsylvania exhibit stark geographic contrasts, with most zip codes in the dark purple range (under 5-10%), while notable clusters of high uninsurance (25-50%, shown in yellow and green) emerge in the central part of the state—likely corresponding to Amish and Plain community populations in Lancaster, Mifflin, and Centre counties—as well as a small cluster in northwestern Pennsylvania near Erie County. The Philadelphia and Pittsburgh metropolitan peripheries generally maintain low uninsured rates, though pockets of moderate uninsurance (10-15%) appear within urban cores. Rural zip codes across the northern tier and Appalachian regions display considerable variability, with gray areas indicating missing data that may reflect sparsely populated zones where reliable estimates are difficult to produce.
Data: U.S. Census Bureau, 2023 ACS
Explore
- Population Non-Hispanic Asian % by Zip Code (ZCTA5) — Oklahoma
- Housing Vacancy Rate by County
- Housing Owner-Occupied % of Units, by Zip Code (ZCTA5) — Pennsylvania
- Housing Median Monthly Rent ($), by Zip Code (ZCTA5) — Pennsylvania
- Housing Vacancy Rate by Zip Code (ZCTA5) — Pennsylvania
- Housing Owner-Occupied Median Value ($), by Zip Code (ZCTA5) — Pennsylvania
- % of Households with Broadband Internet, by Zip Code (ZCTA5) — Pennsylvania
- Bachelor's Degree or Higher (% of Over 25) by Zip Code (ZCTA5) — Pennsylvania
- Household Average Size by Zip Code (ZCTA5) — Pennsylvania
- Housing % of Units Built Since 2010, by Zip Code (ZCTA5) — Pennsylvania
- Married Couple (% of all Households) by Zip Code (ZCTA5) — Pennsylvania
- Population Non-Hispanic Asian % by Zip Code (ZCTA5) — Alaska
- Population Non-Hispanic Asian % by Zip Code (ZCTA5) — Arkansas
- Population Non-Hispanic Asian % by Zip Code (ZCTA5) — Montana
- Population Non-Hispanic Asian % by Zip Code (ZCTA5) — Idaho
- Household Median Income by County
- Household Average Size by County
- U.S. Citizens by County (% of Population Over 18)
- Housing Median Monthly Rent ($), by County
- Housing Owner-Occupied Median Value ($), by County
- Housing Owner-Occupied % of Units, by County
- % of Households with Broadband Internet, by County
- Housing % of Units Built Since 2010, by County
- Population Non-Hispanic Asian % by County
- Married Couple (% of all Households) by County
- Housing Owner-Occupied Median Value ($), by Zip Code (ZCTA5) — California
- Bachelor's Degree or Higher (% of Over 25) by Zip Code (ZCTA5) — California
- Housing Owner-Occupied % of Units, by Zip Code (ZCTA5) — California
- Housing % of Units Built Since 2010, by Zip Code (ZCTA5) — California
- Population Non-Hispanic American Indian % by Zip Code (ZCTA5) — California
- % of Population without Health Insurance, by Zip Code (ZCTA5) — Iowa
- % of Population without Health Insurance, by Zip Code (ZCTA5) — Ohio
- % of Population without Health Insurance, by Zip Code (ZCTA5) — Virginia
- % of Population without Health Insurance, by Zip Code (ZCTA5) — Oregon
- % of Population without Health Insurance, by Zip Code (ZCTA5) — Idaho
- % of Population without Health Insurance, by Zip Code (ZCTA5) — Utah
- % of Population without Health Insurance, by Zip Code (ZCTA5) — California
- % of Population without Health Insurance, by Zip Code (ZCTA5) — Georgia
- % of Population without Health Insurance, by Zip Code (ZCTA5) — Indiana
- % of Population without Health Insurance, by Zip Code (ZCTA5) — Texas