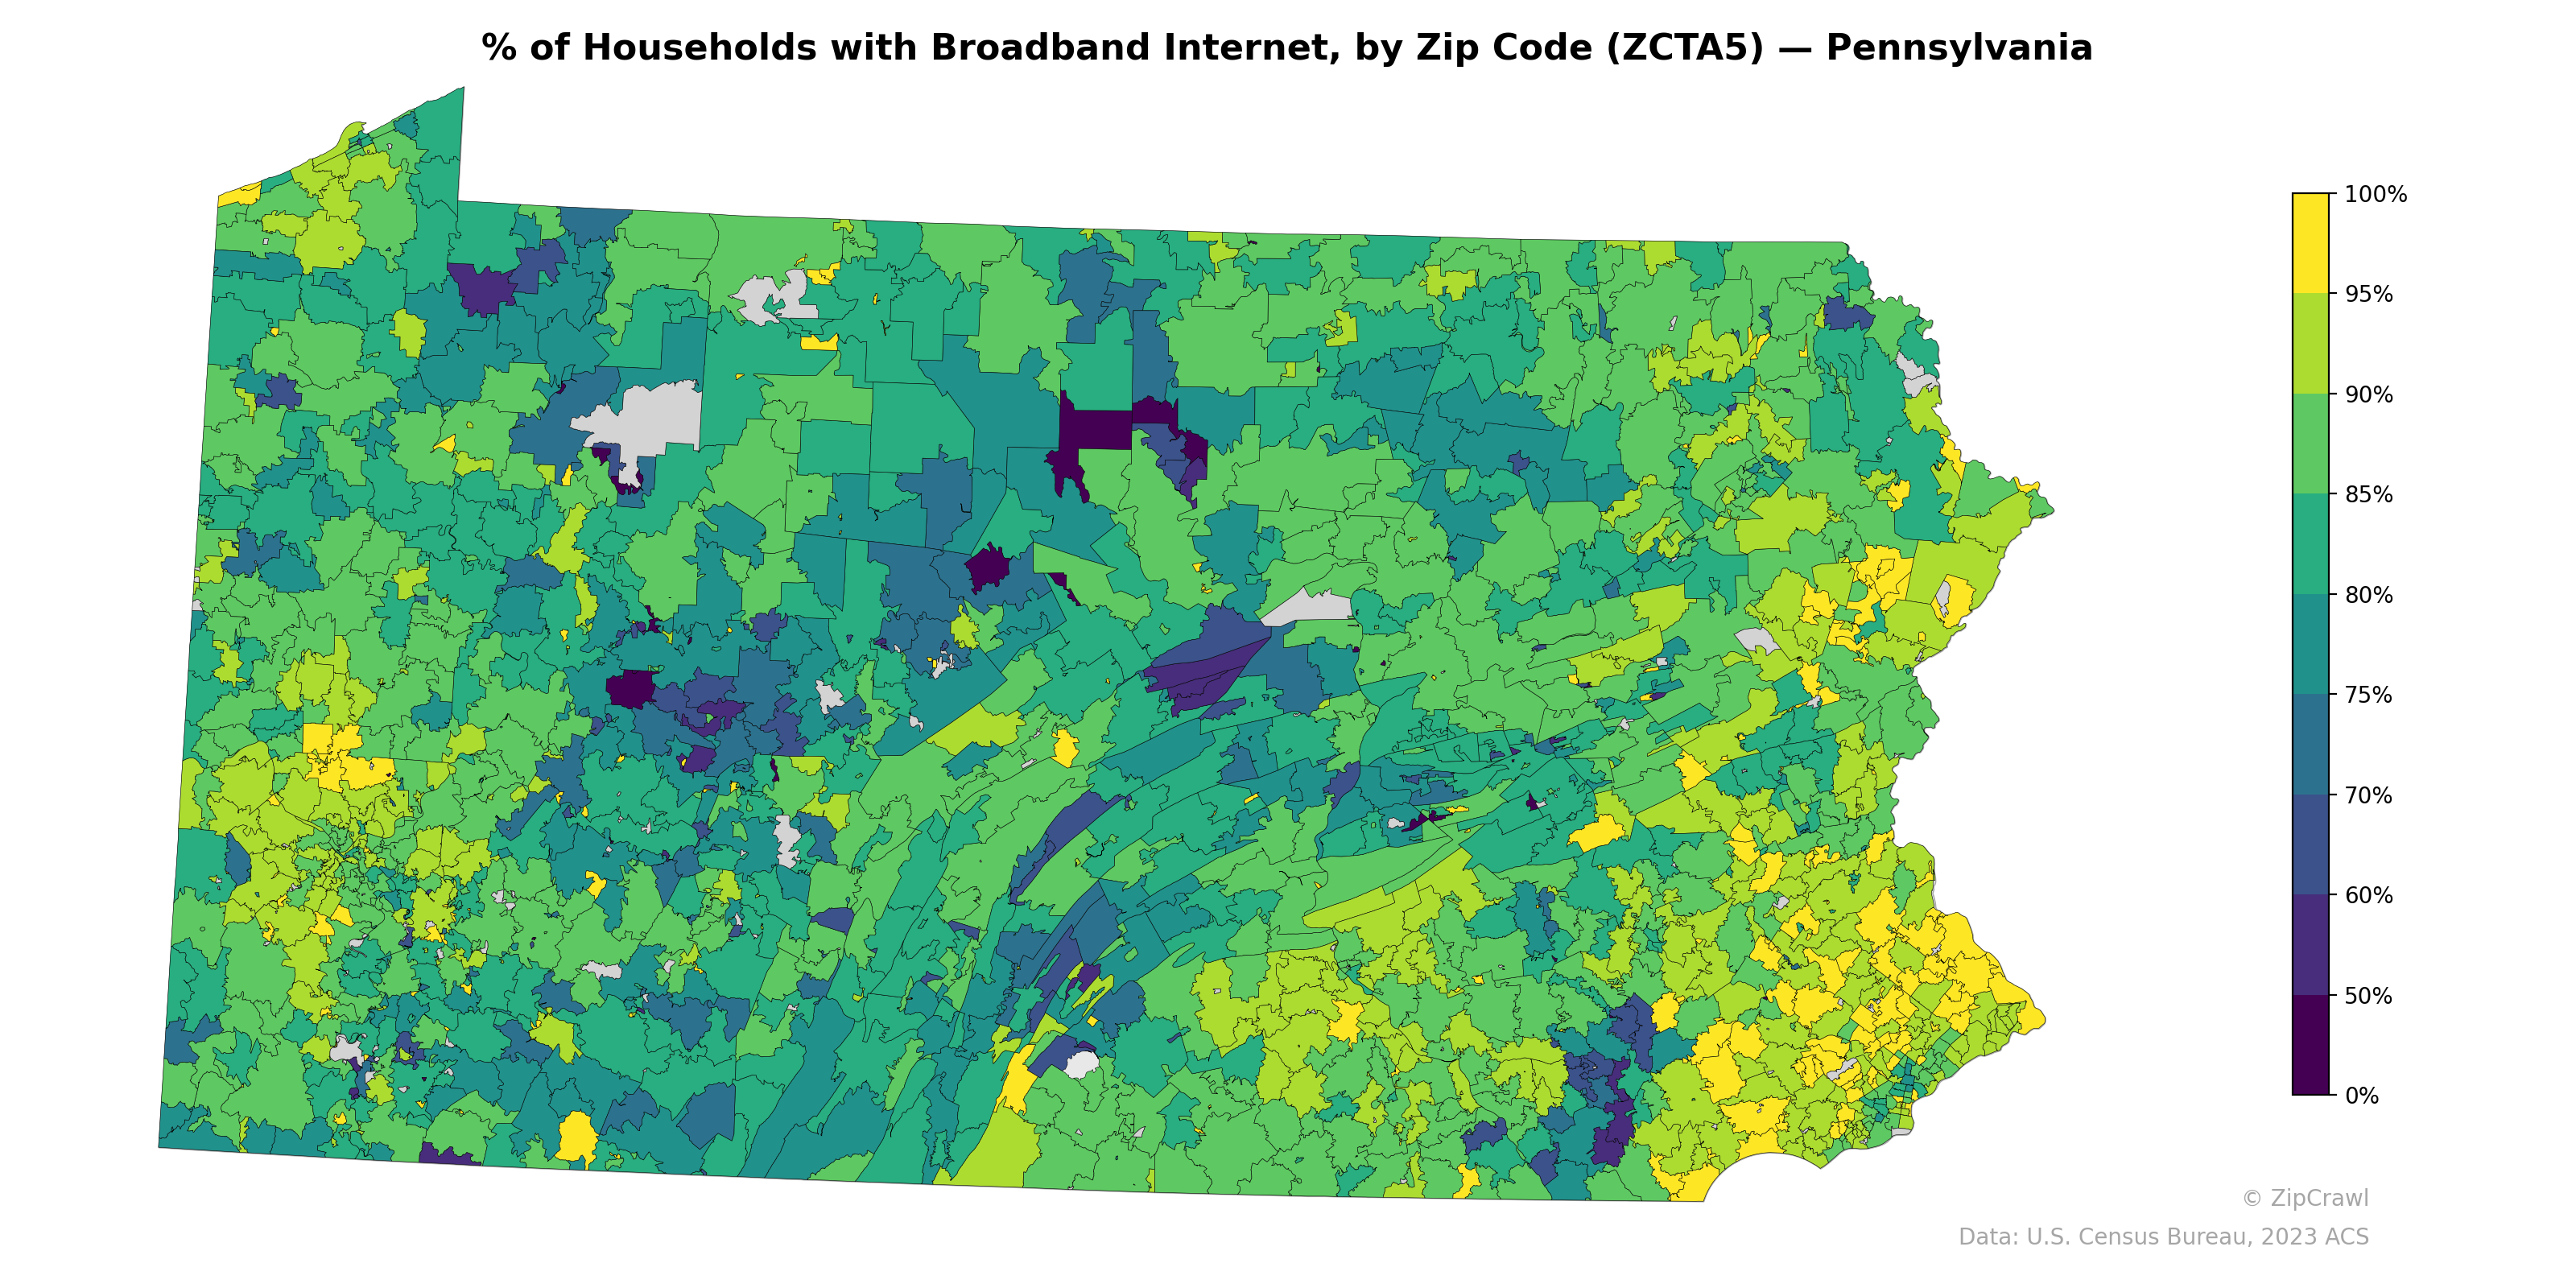
NOTE: Gray indicates insufficient data or a suppressed estimate.
Suburban zip codes surrounding Philadelphia in the southeast exhibit consistently high broadband adoption rates, predominantly in the 85–95%+ range, while the Philadelphia urban core itself contains pockets of significantly lower connectivity. The rural central and north-central regions of the state display the most variability, with scattered zip codes falling below 60% alongside neighboring areas near 75–80%, suggesting uneven infrastructure deployment rather than a uniform rural deficit. Western Pennsylvania around Pittsburgh shows moderate-to-high adoption, though several isolated zip codes in the southwestern coalfield areas and parts of the northern tier near the New York border lag noticeably behind statewide averages.
Data: U.S. Census Bureau, 2023 ACS
Explore
- Housing Vacancy Rate by Zip Code (ZCTA5) — Oklahoma
- Housing Vacancy Rate by County
- Housing Median Monthly Rent ($), by Zip Code (ZCTA5) — Pennsylvania
- Housing Owner-Occupied % of Units, by Zip Code (ZCTA5) — Pennsylvania
- Housing Owner-Occupied Median Value ($), by Zip Code (ZCTA5) — Pennsylvania
- Bachelor's Degree or Higher (% of Over 25) by Zip Code (ZCTA5) — Pennsylvania
- % of Population without Health Insurance, by Zip Code (ZCTA5) — Pennsylvania
- Housing Vacancy Rate by Zip Code (ZCTA5) — Pennsylvania
- Married Couple (% of all Households) by Zip Code (ZCTA5) — Pennsylvania
- Housing % of Units Built Since 2010, by Zip Code (ZCTA5) — Pennsylvania
- Household Average Size by Zip Code (ZCTA5) — Pennsylvania
- Housing Vacancy Rate by Zip Code (ZCTA5) — Alaska
- Housing Vacancy Rate by Zip Code (ZCTA5) — Idaho
- Housing Vacancy Rate by Zip Code (ZCTA5) — Montana
- Housing Vacancy Rate by Zip Code (ZCTA5) — Arkansas
- Household Median Income by County
- Household Average Size by County
- Married Couple (% of all Households) by County
- U.S. Citizens by County (% of Population Over 18)
- Housing Median Monthly Rent ($), by County
- Housing Owner-Occupied Median Value ($), by County
- Housing Owner-Occupied % of Units, by County
- Housing % of Units Built Since 2010, by County
- Population Non-Hispanic Asian % by County
- Housing % of Units Built Since 2010, by Zip Code (ZCTA5) — California
- Housing Owner-Occupied % of Units, by Zip Code (ZCTA5) — California
- Housing Owner-Occupied Median Value ($), by Zip Code (ZCTA5) — California
- Married Couple (% of all Households) by Zip Code (ZCTA5) — California
- Housing Median Monthly Rent ($), by Zip Code (ZCTA5) — California
- Bachelor's Degree or Higher (% of Over 25) by Zip Code (ZCTA5) — California
- % of Households with Broadband Internet, by Zip Code (ZCTA5) — Iowa
- % of Households with Broadband Internet, by Zip Code (ZCTA5) — Ohio
- % of Households with Broadband Internet, by Zip Code (ZCTA5) — Virginia
- % of Households with Broadband Internet, by Zip Code (ZCTA5) — Idaho
- % of Households with Broadband Internet, by Zip Code (ZCTA5) — Utah
- % of Households with Broadband Internet, by Zip Code (ZCTA5) — California
- % of Households with Broadband Internet, by Zip Code (ZCTA5) — Georgia
- % of Households with Broadband Internet, by Zip Code (ZCTA5) — Texas
- % of Households with Broadband Internet, by Zip Code (ZCTA5) — Indiana
- % of Households with Broadband Internet, by Zip Code (ZCTA5) — Oregon