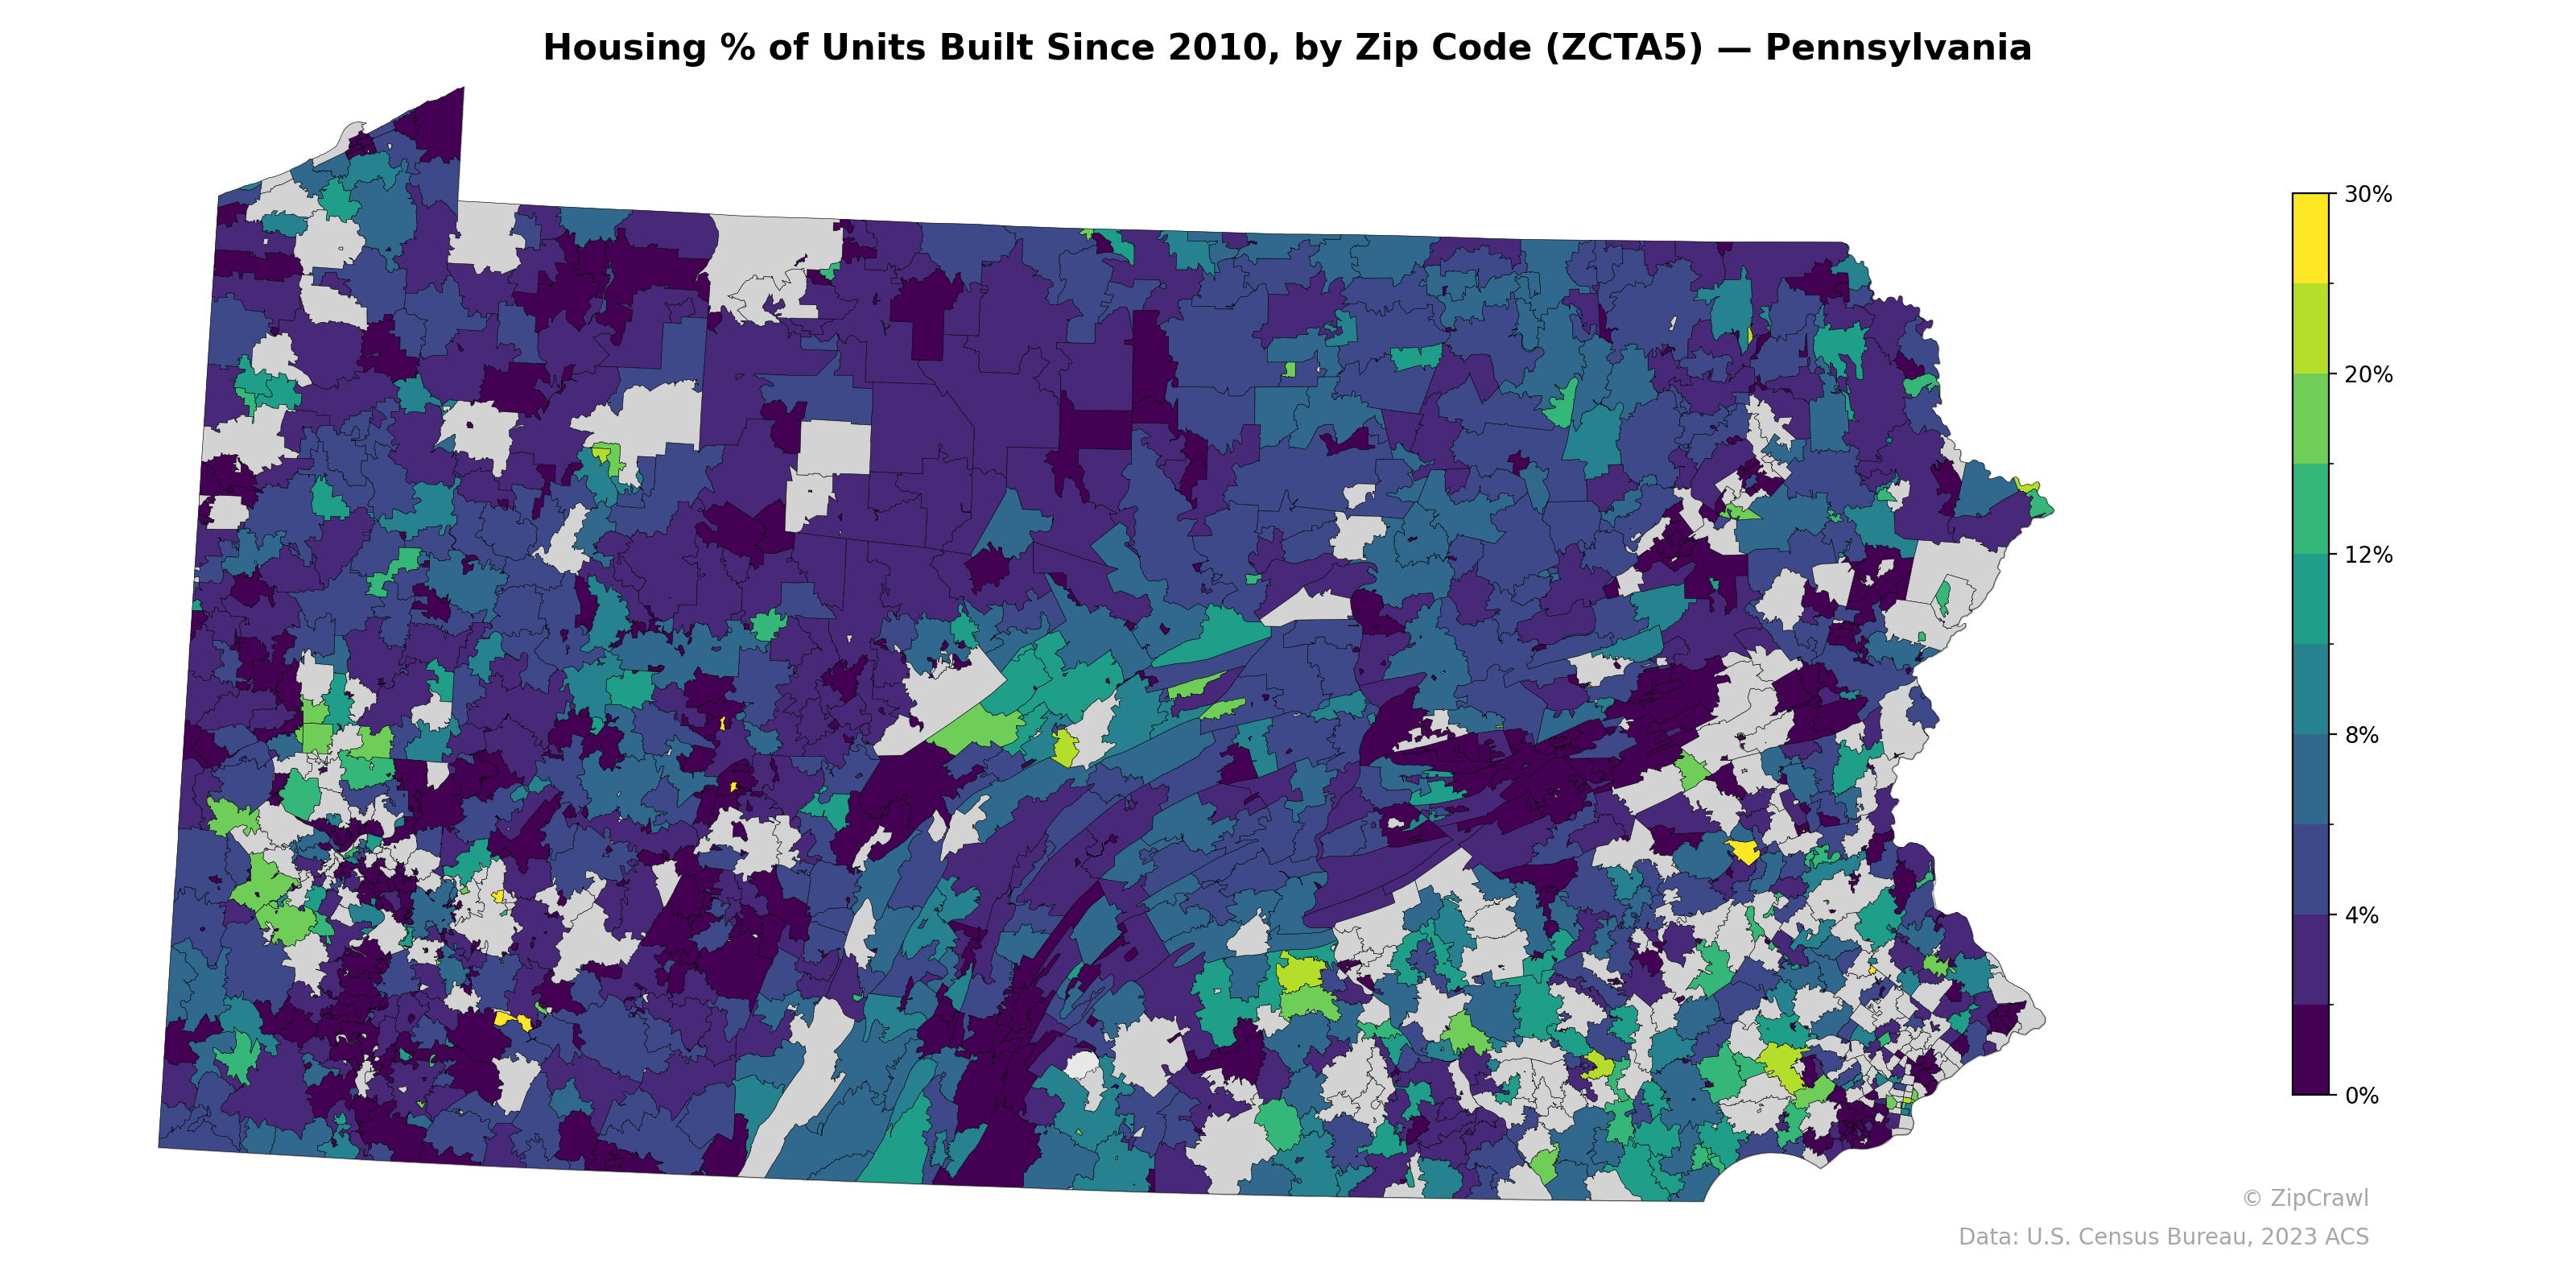
NOTE: Gray indicates insufficient data or a suppressed estimate.
New construction activity concentrates most visibly in the suburban corridors surrounding Pittsburgh in the southwest and in the exurban ring of the Philadelphia metro area to the southeast, where several zip codes exceed 12–20% of housing stock built since 2010. The north-central and northeastern regions of the state are dominated by dark purple tones indicating minimal new construction, typically below 4%, reflecting the slower growth trajectories of rural and post-industrial communities. Scattered bright green and yellow outliers—likely tied to specific developments or smaller housing bases that amplify percentage figures—appear in the central-south corridor near Harrisburg and in pockets of the Lehigh Valley.
Data: U.S. Census Bureau, 2023 ACS
Explore
- Median Age by Zip Code (ZCTA5) — Connecticut
- Housing Vacancy Rate by County
- Housing Owner-Occupied Median Value ($), by Zip Code (ZCTA5) — Pennsylvania
- % of Population without Health Insurance, by Zip Code (ZCTA5) — Pennsylvania
- Housing Owner-Occupied % of Units, by Zip Code (ZCTA5) — Pennsylvania
- Bachelor's Degree or Higher (% of Over 25) by Zip Code (ZCTA5) — Pennsylvania
- % of Households with Broadband Internet, by Zip Code (ZCTA5) — Pennsylvania
- Housing Vacancy Rate by Zip Code (ZCTA5) — Pennsylvania
- Married Couple (% of all Households) by Zip Code (ZCTA5) — Pennsylvania
- Housing Median Monthly Rent ($), by Zip Code (ZCTA5) — Pennsylvania
- Household Average Size by Zip Code (ZCTA5) — Pennsylvania
- Median Age by Zip Code (ZCTA5) — West Virginia
- Median Age by Zip Code (ZCTA5) — Rhode Island
- Median Age by Zip Code (ZCTA5) — Vermont
- Median Age by Zip Code (ZCTA5) — Mississippi
- Household Median Income by County
- U.S. Citizens by County (% of Population Over 18)
- Household Average Size by County
- Housing Median Monthly Rent ($), by County
- Housing Owner-Occupied Median Value ($), by County
- Housing Owner-Occupied % of Units, by County
- % of Households with Broadband Internet, by County
- Population Non-Hispanic Asian % by County
- Married Couple (% of all Households) by County
- Housing Owner-Occupied % of Units, by Zip Code (ZCTA5) — California
- Bachelor's Degree or Higher (% of Over 25) by Zip Code (ZCTA5) — California
- % of Population without Health Insurance, by Zip Code (ZCTA5) — California
- Housing Owner-Occupied Median Value ($), by Zip Code (ZCTA5) — California
- Population Non-Hispanic American Indian % by Zip Code (ZCTA5) — California
- High School Graduate (% of Over 25) by Zip Code (ZCTA5) — California
- Housing % of Units Built Since 2010, by Zip Code (ZCTA5) — Ohio
- Housing % of Units Built Since 2010, by Zip Code (ZCTA5) — Utah
- Housing % of Units Built Since 2010, by Zip Code (ZCTA5) — Virginia
- Housing % of Units Built Since 2010, by Zip Code (ZCTA5) — Iowa
- Housing % of Units Built Since 2010, by Zip Code (ZCTA5) — California
- Housing % of Units Built Since 2010, by Zip Code (ZCTA5) — Georgia
- Housing % of Units Built Since 2010, by Zip Code (ZCTA5) — Oregon
- Housing % of Units Built Since 2010, by Zip Code (ZCTA5) — Texas
- Housing % of Units Built Since 2010, by Zip Code (ZCTA5) — Idaho
- Housing % of Units Built Since 2010, by Zip Code (ZCTA5) — Hawaii