NOTE: Gray indicates insufficient data or a suppressed estimate.
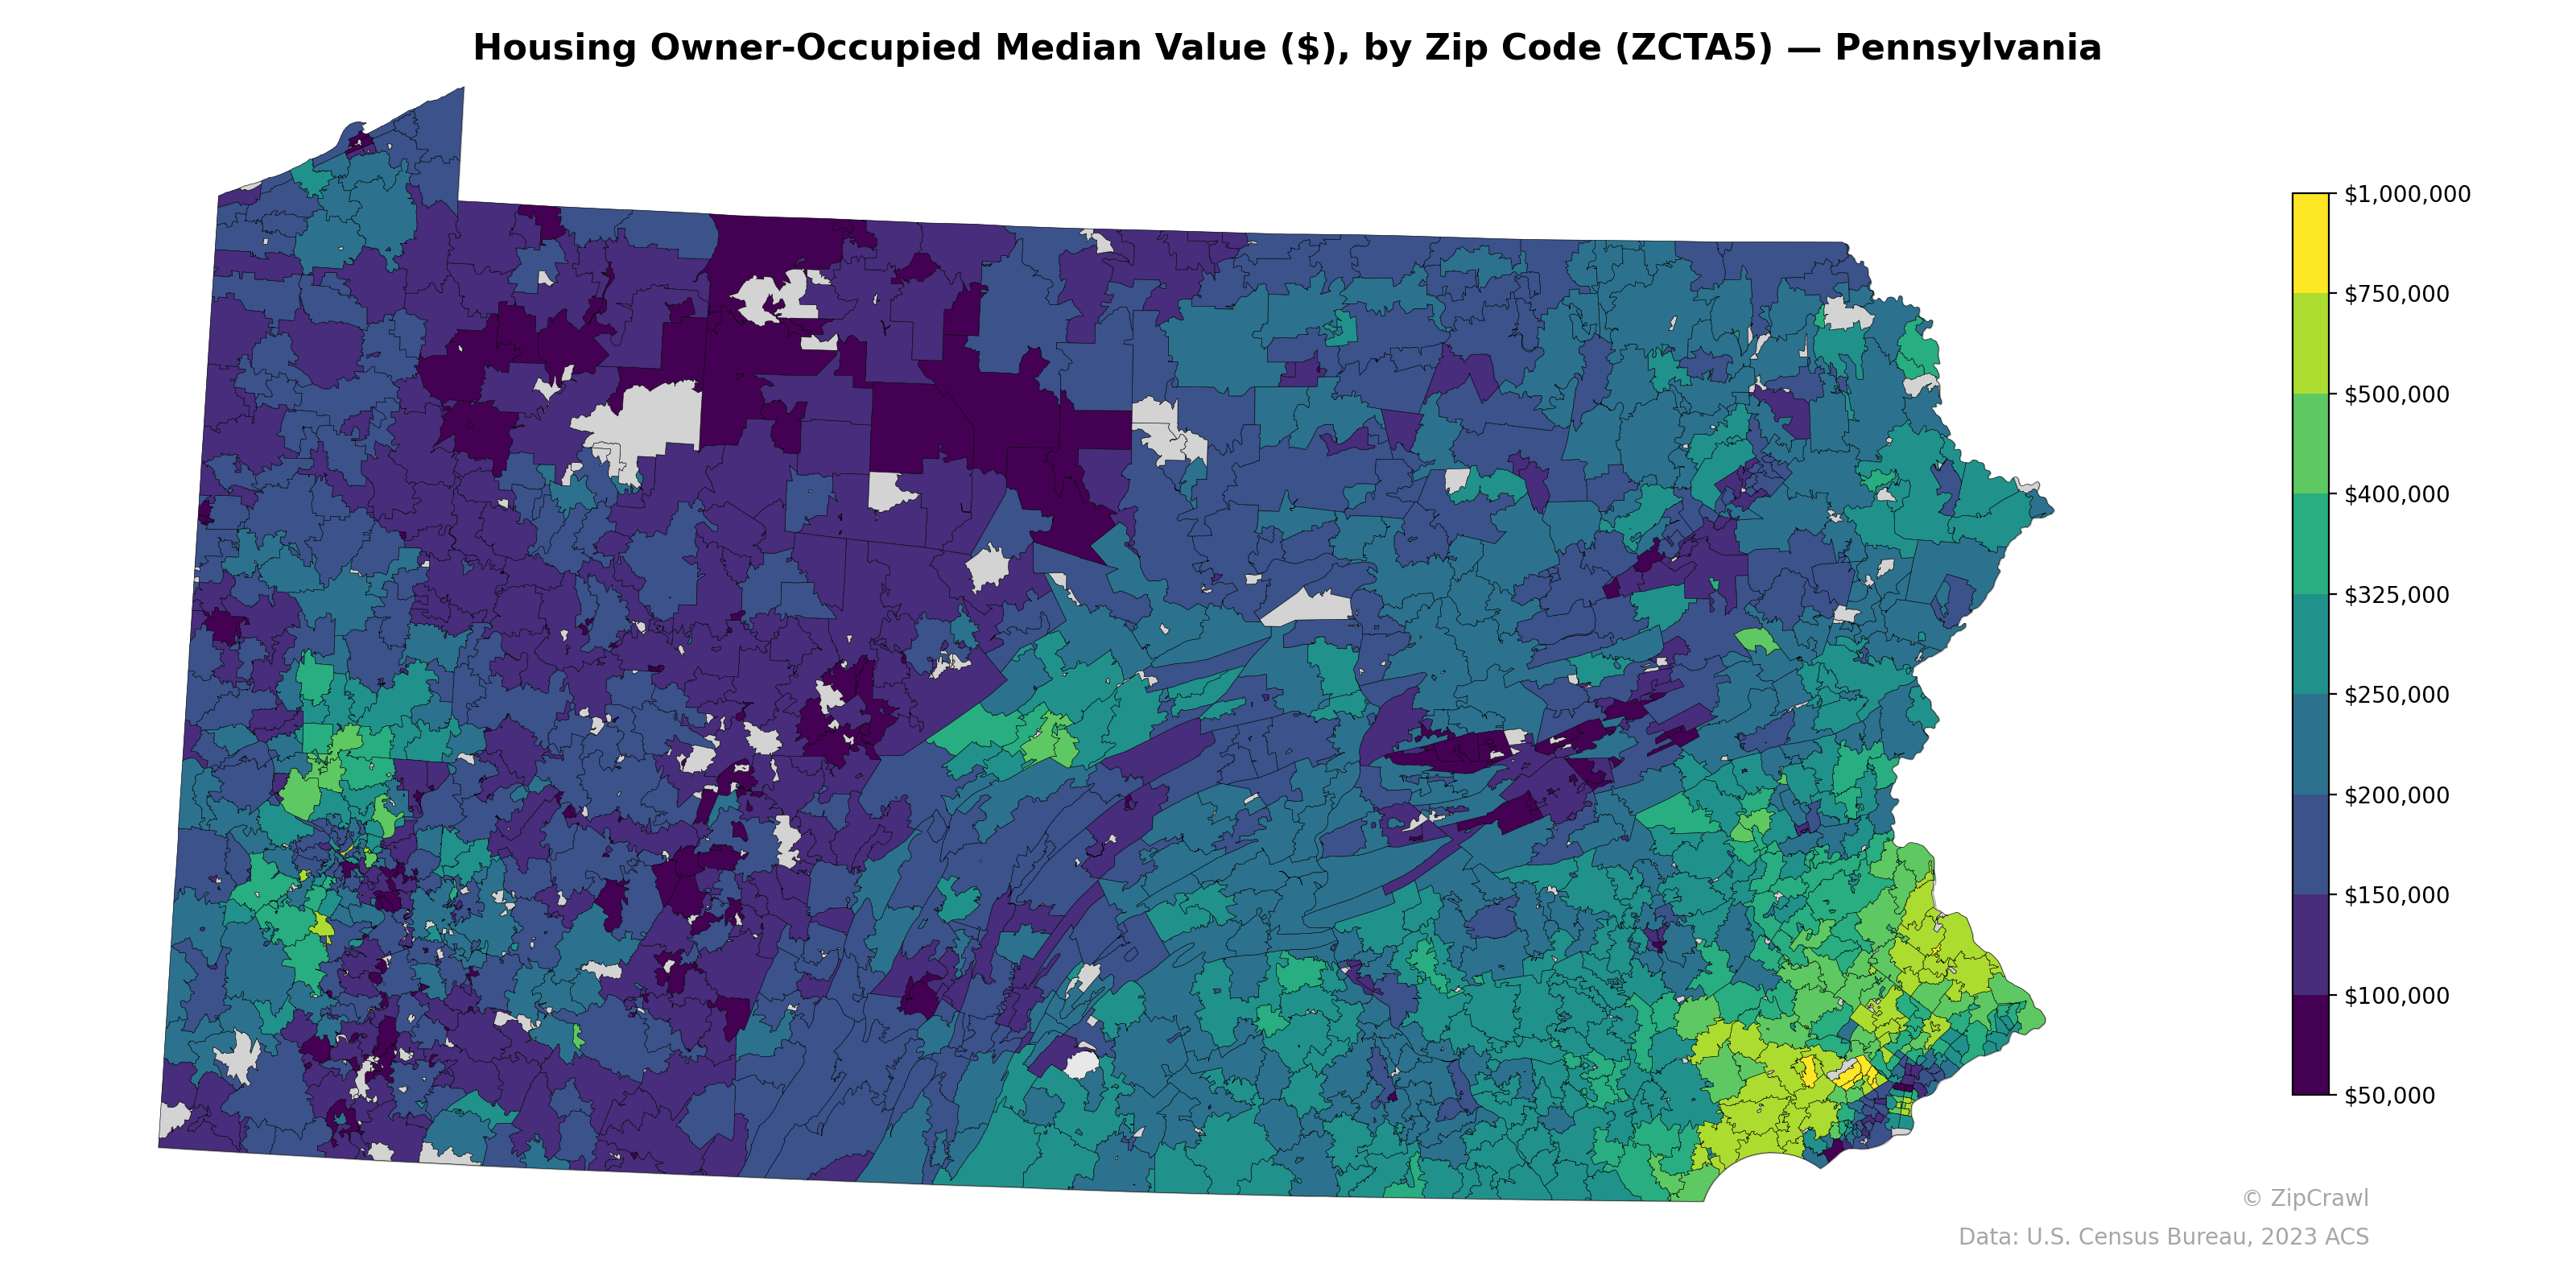
The Philadelphia metropolitan area in the southeastern corner of the state exhibits the highest median home values, with several zip codes exceeding $500,000 and pockets approaching $1,000,000, creating a sharp contrast with the rural central and northern tier regions where values predominantly fall between $100,000 and $200,000. The Pittsburgh metro area in the southwest displays a more modest value cluster, generally ranging from $150,000 to $300,000, with notable pockets of very low values in the urban core surrounded by higher-value suburban zip codes. A broad swath of lower-value zip codes stretches across the northern and central Appalachian portions of the state, while secondary value corridors emerge along the I-76/Pennsylvania Turnpike axis and in the Lehigh Valley region of the east.
Data: U.S. Census Bureau, 2023 ACS
Explore
- U.S. Citizens (% of Population Over 18) by Zip Code (ZCTA5) — Connecticut
- Housing Vacancy Rate by County
- Housing Median Monthly Rent ($), by Zip Code (ZCTA5) — Pennsylvania
- % of Population without Health Insurance, by Zip Code (ZCTA5) — Pennsylvania
- Housing Owner-Occupied % of Units, by Zip Code (ZCTA5) — Pennsylvania
- Bachelor's Degree or Higher (% of Over 25) by Zip Code (ZCTA5) — Pennsylvania
- % of Households with Broadband Internet, by Zip Code (ZCTA5) — Pennsylvania
- Housing Vacancy Rate by Zip Code (ZCTA5) — Pennsylvania
- Married Couple (% of all Households) by Zip Code (ZCTA5) — Pennsylvania
- Housing % of Units Built Since 2010, by Zip Code (ZCTA5) — Pennsylvania
- Household Average Size by Zip Code (ZCTA5) — Pennsylvania
- U.S. Citizens (% of Population Over 18) by Zip Code (ZCTA5) — West Virginia
- U.S. Citizens (% of Population Over 18) by Zip Code (ZCTA5) — Rhode Island
- U.S. Citizens (% of Population Over 18) by Zip Code (ZCTA5) — Vermont
- U.S. Citizens (% of Population Over 18) by Zip Code (ZCTA5) — Mississippi
- Household Median Income by County
- Household Average Size by County
- Married Couple (% of all Households) by County
- U.S. Citizens by County (% of Population Over 18)
- Housing Median Monthly Rent ($), by County
- Housing Owner-Occupied % of Units, by County
- % of Households with Broadband Internet, by County
- Housing % of Units Built Since 2010, by County
- Population Non-Hispanic Asian % by County
- Housing Owner-Occupied % of Units, by Zip Code (ZCTA5) — California
- Bachelor's Degree or Higher (% of Over 25) by Zip Code (ZCTA5) — California
- % of Population without Health Insurance, by Zip Code (ZCTA5) — California
- Housing % of Units Built Since 2010, by Zip Code (ZCTA5) — California
- Population Non-Hispanic American Indian % by Zip Code (ZCTA5) — California
- High School Graduate (% of Over 25) by Zip Code (ZCTA5) — California
- Housing Owner-Occupied Median Value ($), by Zip Code (ZCTA5) — Virginia
- Housing Owner-Occupied Median Value ($), by Zip Code (ZCTA5) — Ohio
- Housing Owner-Occupied Median Value ($), by Zip Code (ZCTA5) — Iowa
- Housing Owner-Occupied Median Value ($), by Zip Code (ZCTA5) — Maine
- Housing Owner-Occupied Median Value ($), by Zip Code (ZCTA5) — Utah
- Housing Owner-Occupied Median Value ($), by Zip Code (ZCTA5) — California
- Housing Owner-Occupied Median Value ($), by Zip Code (ZCTA5) — Georgia
- Housing Owner-Occupied Median Value ($), by Zip Code (ZCTA5) — Indiana
- Housing Owner-Occupied Median Value ($), by Zip Code (ZCTA5) — Oregon
- Housing Owner-Occupied Median Value ($), by Zip Code (ZCTA5) — Texas