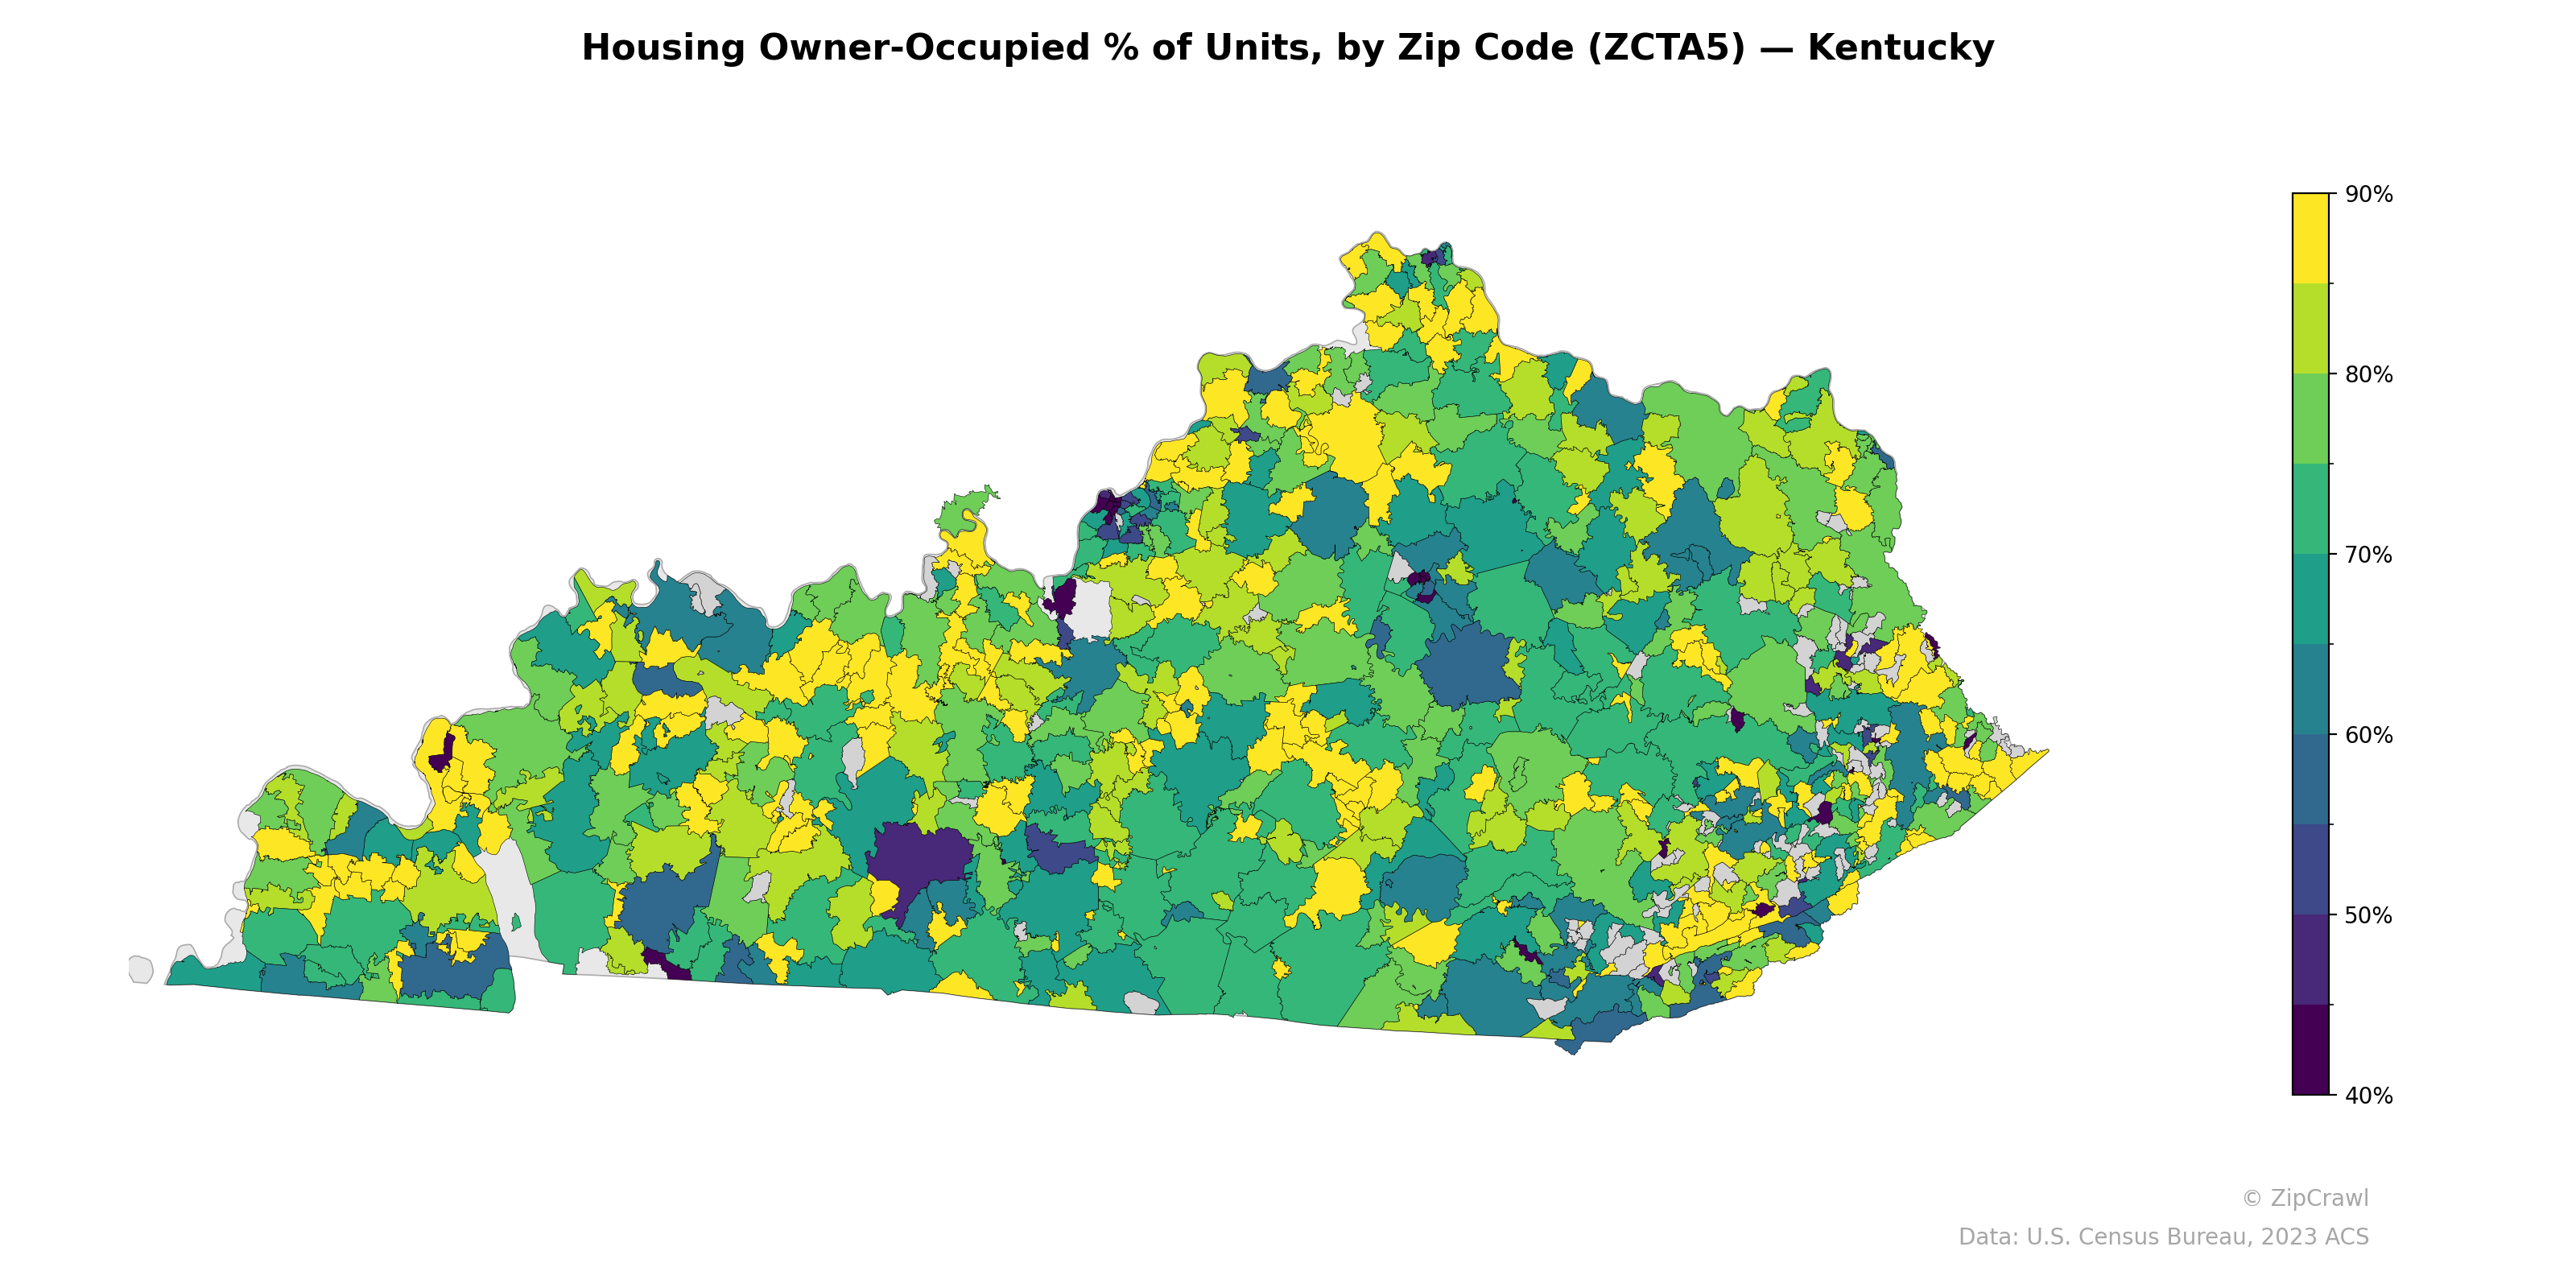
NOTE: Gray indicates insufficient data or a suppressed estimate.
Owner-occupancy rates across Kentucky zip codes range broadly from under 40% to above 90%, with the highest concentrations of homeownership (yellow, 80–90%+) clustered in rural areas of western Kentucky, parts of the north-central region, and scattered pockets in the eastern portion of the state. Urban centers—most notably the Louisville metro area in the northwest, Lexington in the central region, and smaller college or regional hub cities—stand out as distinctly darker (teal to deep purple), reflecting owner-occupancy rates below 55%, consistent with higher renter populations. The southeastern Appalachian corridor displays notable heterogeneity, with adjacent zip codes often varying sharply between high and low homeownership, likely reflecting the influence of small towns, coal-economy dynamics, and pockets of subsidized or rental housing amid otherwise rural owner-occupied communities.
Data: U.S. Census Bureau, 2023 ACS
Explore
- Median Age by Zip Code (ZCTA5) — California
- Housing % of Units Built Since 2010, by Zip Code (ZCTA5) — Kentucky
- High School Graduate (% of Over 25) by Zip Code (ZCTA5) — Kentucky
- Housing Median Monthly Rent ($), by Zip Code (ZCTA5) — Kentucky
- % of Households with Broadband Internet, by Zip Code (ZCTA5) — Kentucky
- Household Average Size by Zip Code (ZCTA5) — Kentucky
- % of Population without Health Insurance, by Zip Code (ZCTA5) — Kentucky
- Bachelor's Degree or Higher (% of Over 25) by Zip Code (ZCTA5) — Kentucky
- Population Non-Hispanic American Indian % by Zip Code (ZCTA5) — Kentucky
- Housing Owner-Occupied Median Value ($), by Zip Code (ZCTA5) — Kentucky
- % of Households with Broadband Internet, by County
- Population Non-Hispanic American Indian % by Zip Code (ZCTA5) — California
- Population Non-Hispanic Black % by Zip Code (ZCTA5) — California
- Population Non-Hispanic White % by Zip Code (ZCTA5) — California
- Population Hispanic % by Zip Code (ZCTA5) — California
- U.S. Citizens (% of Population Over 18) by Zip Code (ZCTA5) — California
- % of Population on Food Stamps or SNAP (Last 12 Months), by Zip Code (ZCTA5) — Texas
- Population Non-Hispanic Asian % by Zip Code (ZCTA5) — Texas
- Household Median Income by Zip Code (ZCTA5) — California
- High School Graduate (% of Over 25) by Zip Code (ZCTA5) — California
- Population Non-Hispanic White % by Zip Code (ZCTA5) — New York
- Housing Median Monthly Rent ($), by Zip Code (ZCTA5) — Alabama
- Housing Owner-Occupied Median Value ($), by Zip Code (ZCTA5) — Alabama
- Housing % of Units Built Since 2010, by Zip Code (ZCTA5) — Alabama
- Household Average Size by Zip Code (ZCTA5) — Alabama
- Married Couple (% of all Households) by Zip Code (ZCTA5) — Alabama
- Population Hispanic % by Zip Code (ZCTA5) — Louisiana
- % of Population without Health Insurance, by Zip Code (ZCTA5) — Alabama
- Housing Vacancy Rate by Zip Code (ZCTA5) — Alabama
- % of Households with Broadband Internet, by Zip Code (ZCTA5) — Alabama
- Housing Owner-Occupied % of Units, by Zip Code (ZCTA5) — Ohio
- Housing Owner-Occupied % of Units, by Zip Code (ZCTA5) — Utah
- Housing Owner-Occupied % of Units, by Zip Code (ZCTA5) — Kansas
- Housing Owner-Occupied % of Units, by Zip Code (ZCTA5) — Iowa
- Housing Owner-Occupied % of Units, by Zip Code (ZCTA5) — Texas
- Housing Owner-Occupied % of Units, by Zip Code (ZCTA5) — Oregon
- Housing Owner-Occupied % of Units, by Zip Code (ZCTA5) — Idaho
- Housing Owner-Occupied % of Units, by Zip Code (ZCTA5) — Hawaii
- Housing Owner-Occupied % of Units, by Zip Code (ZCTA5) — Maine
- Housing Owner-Occupied % of Units, by Zip Code (ZCTA5) — Wyoming