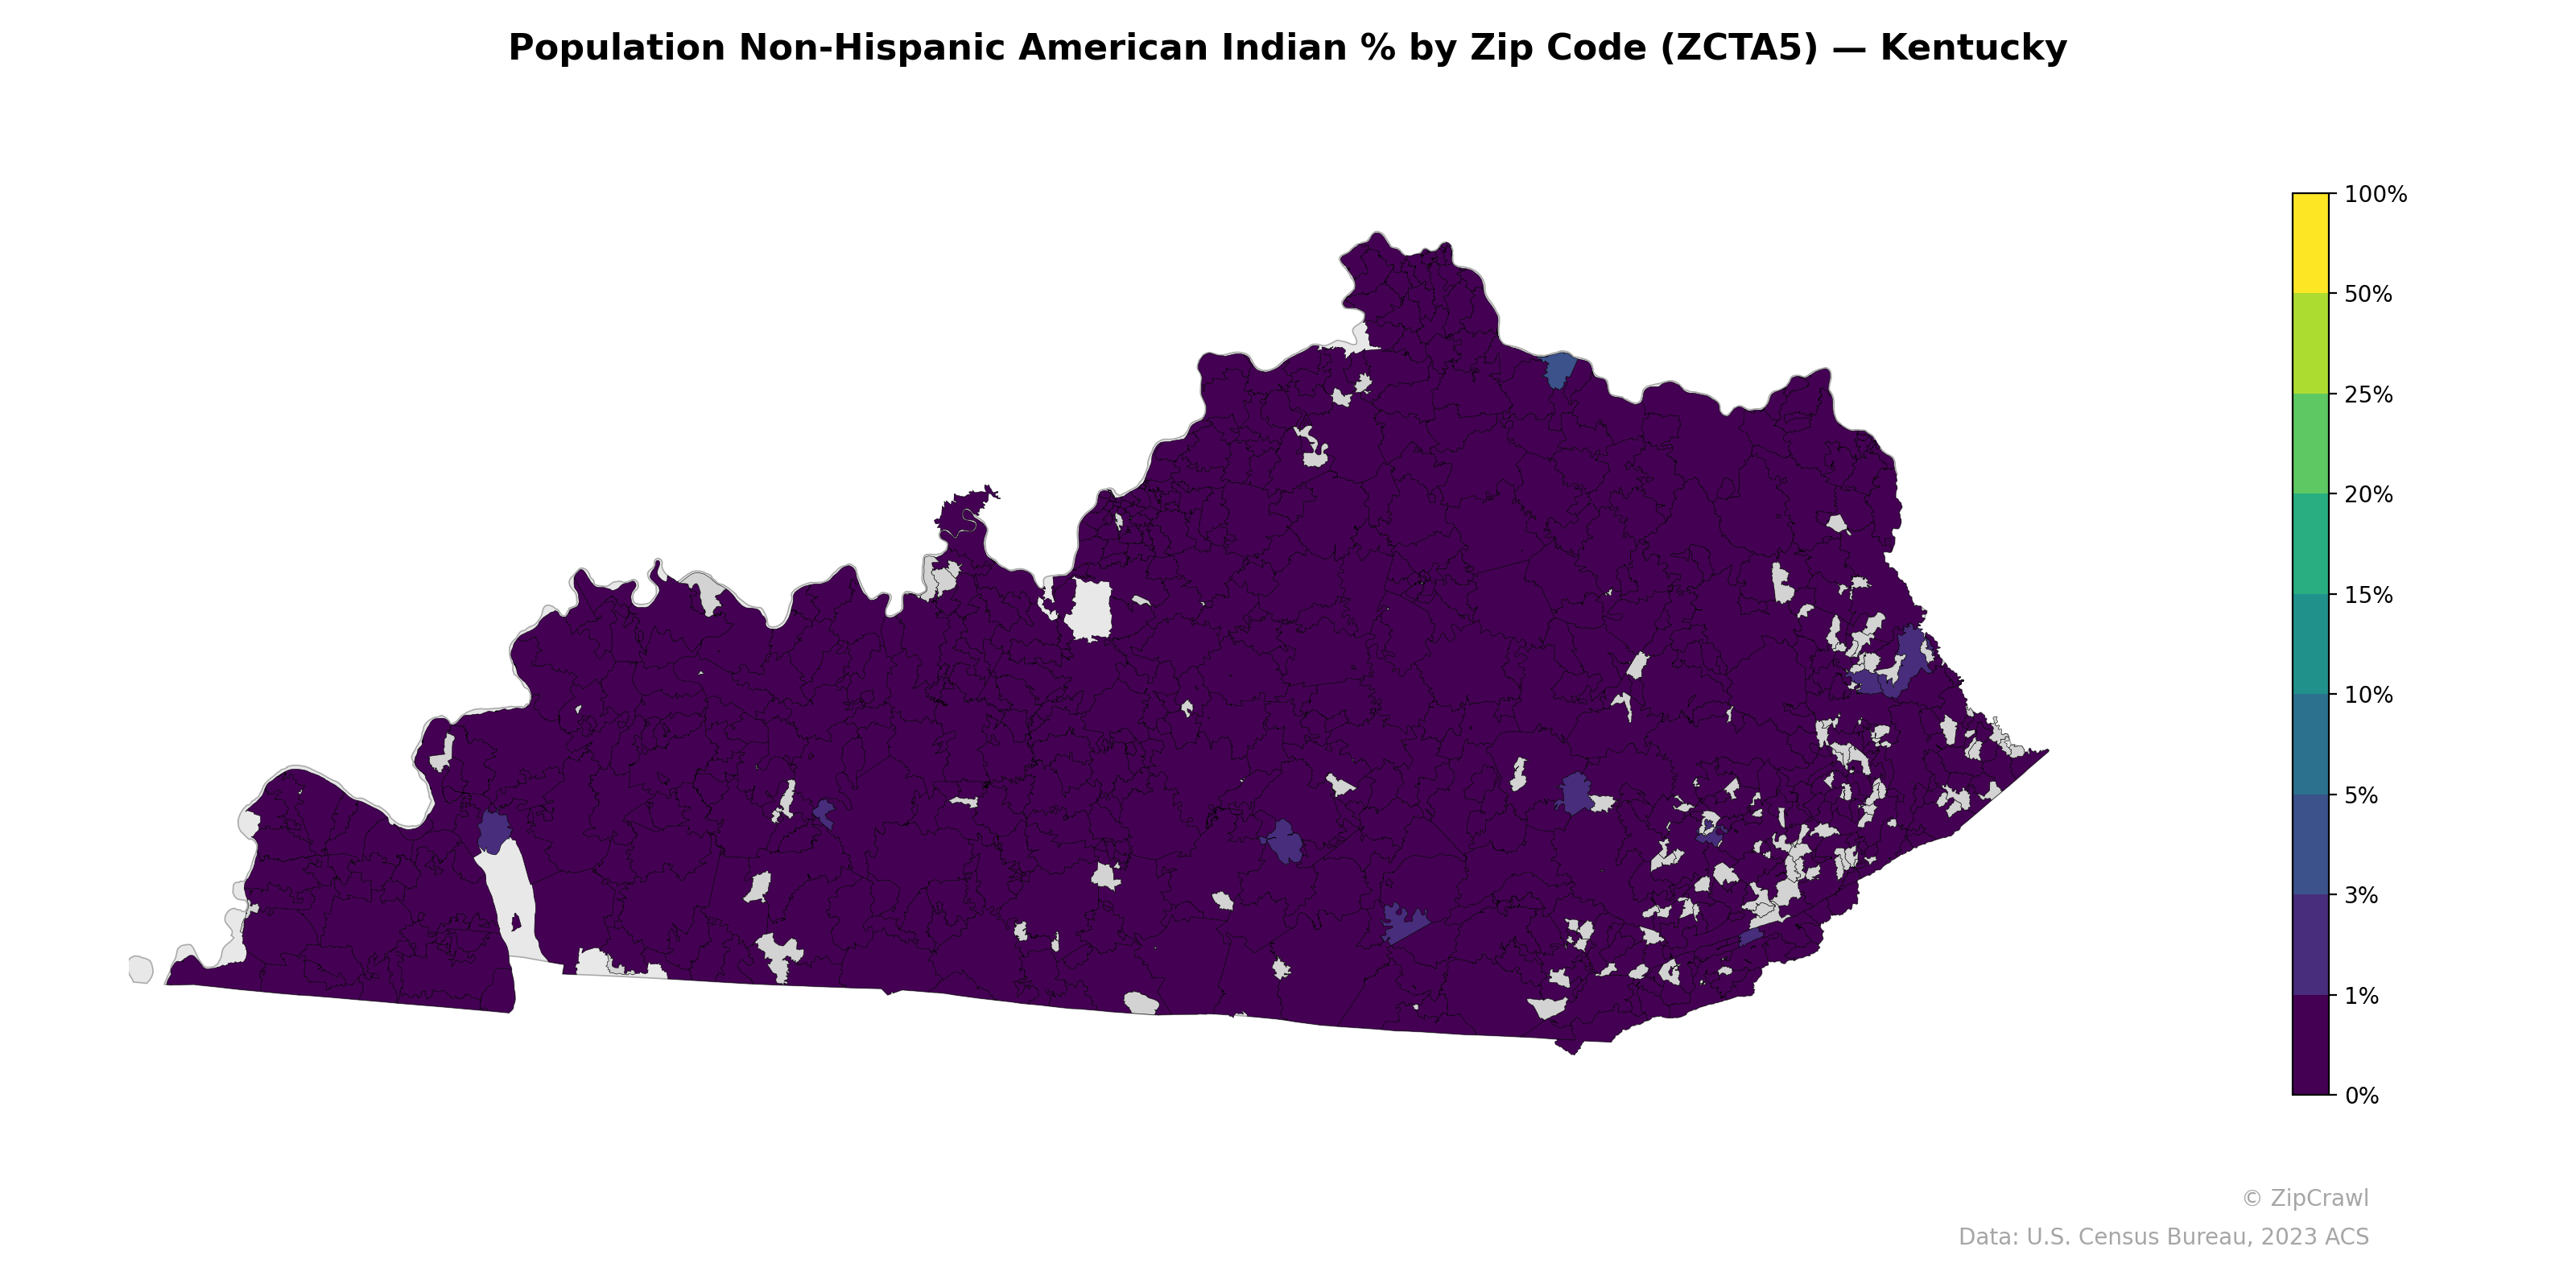
NOTE: Gray indicates insufficient data or a suppressed estimate.
Kentucky's Non-Hispanic American Indian population percentage is uniformly very low across virtually all zip codes, with the overwhelming majority of the state registering at or near 0% as indicated by the deep purple shading. A few scattered zip codes in the western part of the state near the Purchase region and isolated areas in the northern and eastern portions display slightly elevated but still minimal percentages, likely in the 1-3% range. The absence of any zip codes reaching even moderate percentage levels underscores that Kentucky lacks significant concentrated American Indian population centers, consistent with the state's overall demographic composition.
Data: U.S. Census Bureau, 2023 ACS
Explore
- Median Age by Zip Code (ZCTA5) — California
- High School Graduate (% of Over 25) by Zip Code (ZCTA5) — Kentucky
- Housing % of Units Built Since 2010, by Zip Code (ZCTA5) — Kentucky
- Bachelor's Degree or Higher (% of Over 25) by Zip Code (ZCTA5) — Kentucky
- Household Average Size by Zip Code (ZCTA5) — Kentucky
- Housing Owner-Occupied % of Units, by Zip Code (ZCTA5) — Kentucky
- % of Households with Broadband Internet, by Zip Code (ZCTA5) — Kentucky
- Housing Median Monthly Rent ($), by Zip Code (ZCTA5) — Kentucky
- % of Population without Health Insurance, by Zip Code (ZCTA5) — Kentucky
- Housing Owner-Occupied Median Value ($), by Zip Code (ZCTA5) — Kentucky
- % of Households with Broadband Internet, by County
- High School Graduate (% of Over 25) by Zip Code (ZCTA5) — California
- Population Non-Hispanic Black % by Zip Code (ZCTA5) — California
- Population Non-Hispanic White % by Zip Code (ZCTA5) — California
- Population Hispanic % by Zip Code (ZCTA5) — California
- Population Non-Hispanic Asian % by Zip Code (ZCTA5) — Texas
- U.S. Citizens (% of Population Over 18) by Zip Code (ZCTA5) — California
- % of Population on Food Stamps or SNAP (Last 12 Months), by Zip Code (ZCTA5) — Texas
- Household Median Income by Zip Code (ZCTA5) — California
- Population Non-Hispanic Asian % by Zip Code (ZCTA5) — Florida
- Housing Owner-Occupied Median Value ($), by Zip Code (ZCTA5) — Alabama
- Housing Owner-Occupied % of Units, by Zip Code (ZCTA5) — Alabama
- Housing Median Monthly Rent ($), by Zip Code (ZCTA5) — Alabama
- Housing % of Units Built Since 2010, by Zip Code (ZCTA5) — Alabama
- Household Average Size by Zip Code (ZCTA5) — Alabama
- Population Hispanic % by Zip Code (ZCTA5) — Louisiana
- Married Couple (% of all Households) by Zip Code (ZCTA5) — Alabama
- % of Population without Health Insurance, by Zip Code (ZCTA5) — Alabama
- % of Households with Broadband Internet, by Zip Code (ZCTA5) — Alabama
- Housing Vacancy Rate by Zip Code (ZCTA5) — Alabama
- Population Non-Hispanic American Indian % by Zip Code (ZCTA5) — Indiana
- Population Non-Hispanic American Indian % by Zip Code (ZCTA5) — Iowa
- Population Non-Hispanic American Indian % by Zip Code (ZCTA5) — Kansas
- Population Non-Hispanic American Indian % by Zip Code (ZCTA5) — Idaho
- Population Non-Hispanic American Indian % by Zip Code (ZCTA5) — Utah
- Population Non-Hispanic American Indian % by Zip Code (ZCTA5) — Ohio
- Population Non-Hispanic American Indian % by Zip Code (ZCTA5) — Nevada
- Population Non-Hispanic American Indian % by Zip Code (ZCTA5) — Texas
- Population Non-Hispanic American Indian % by Zip Code (ZCTA5) — Oregon
- Population Non-Hispanic American Indian % by Zip Code (ZCTA5) — Hawaii