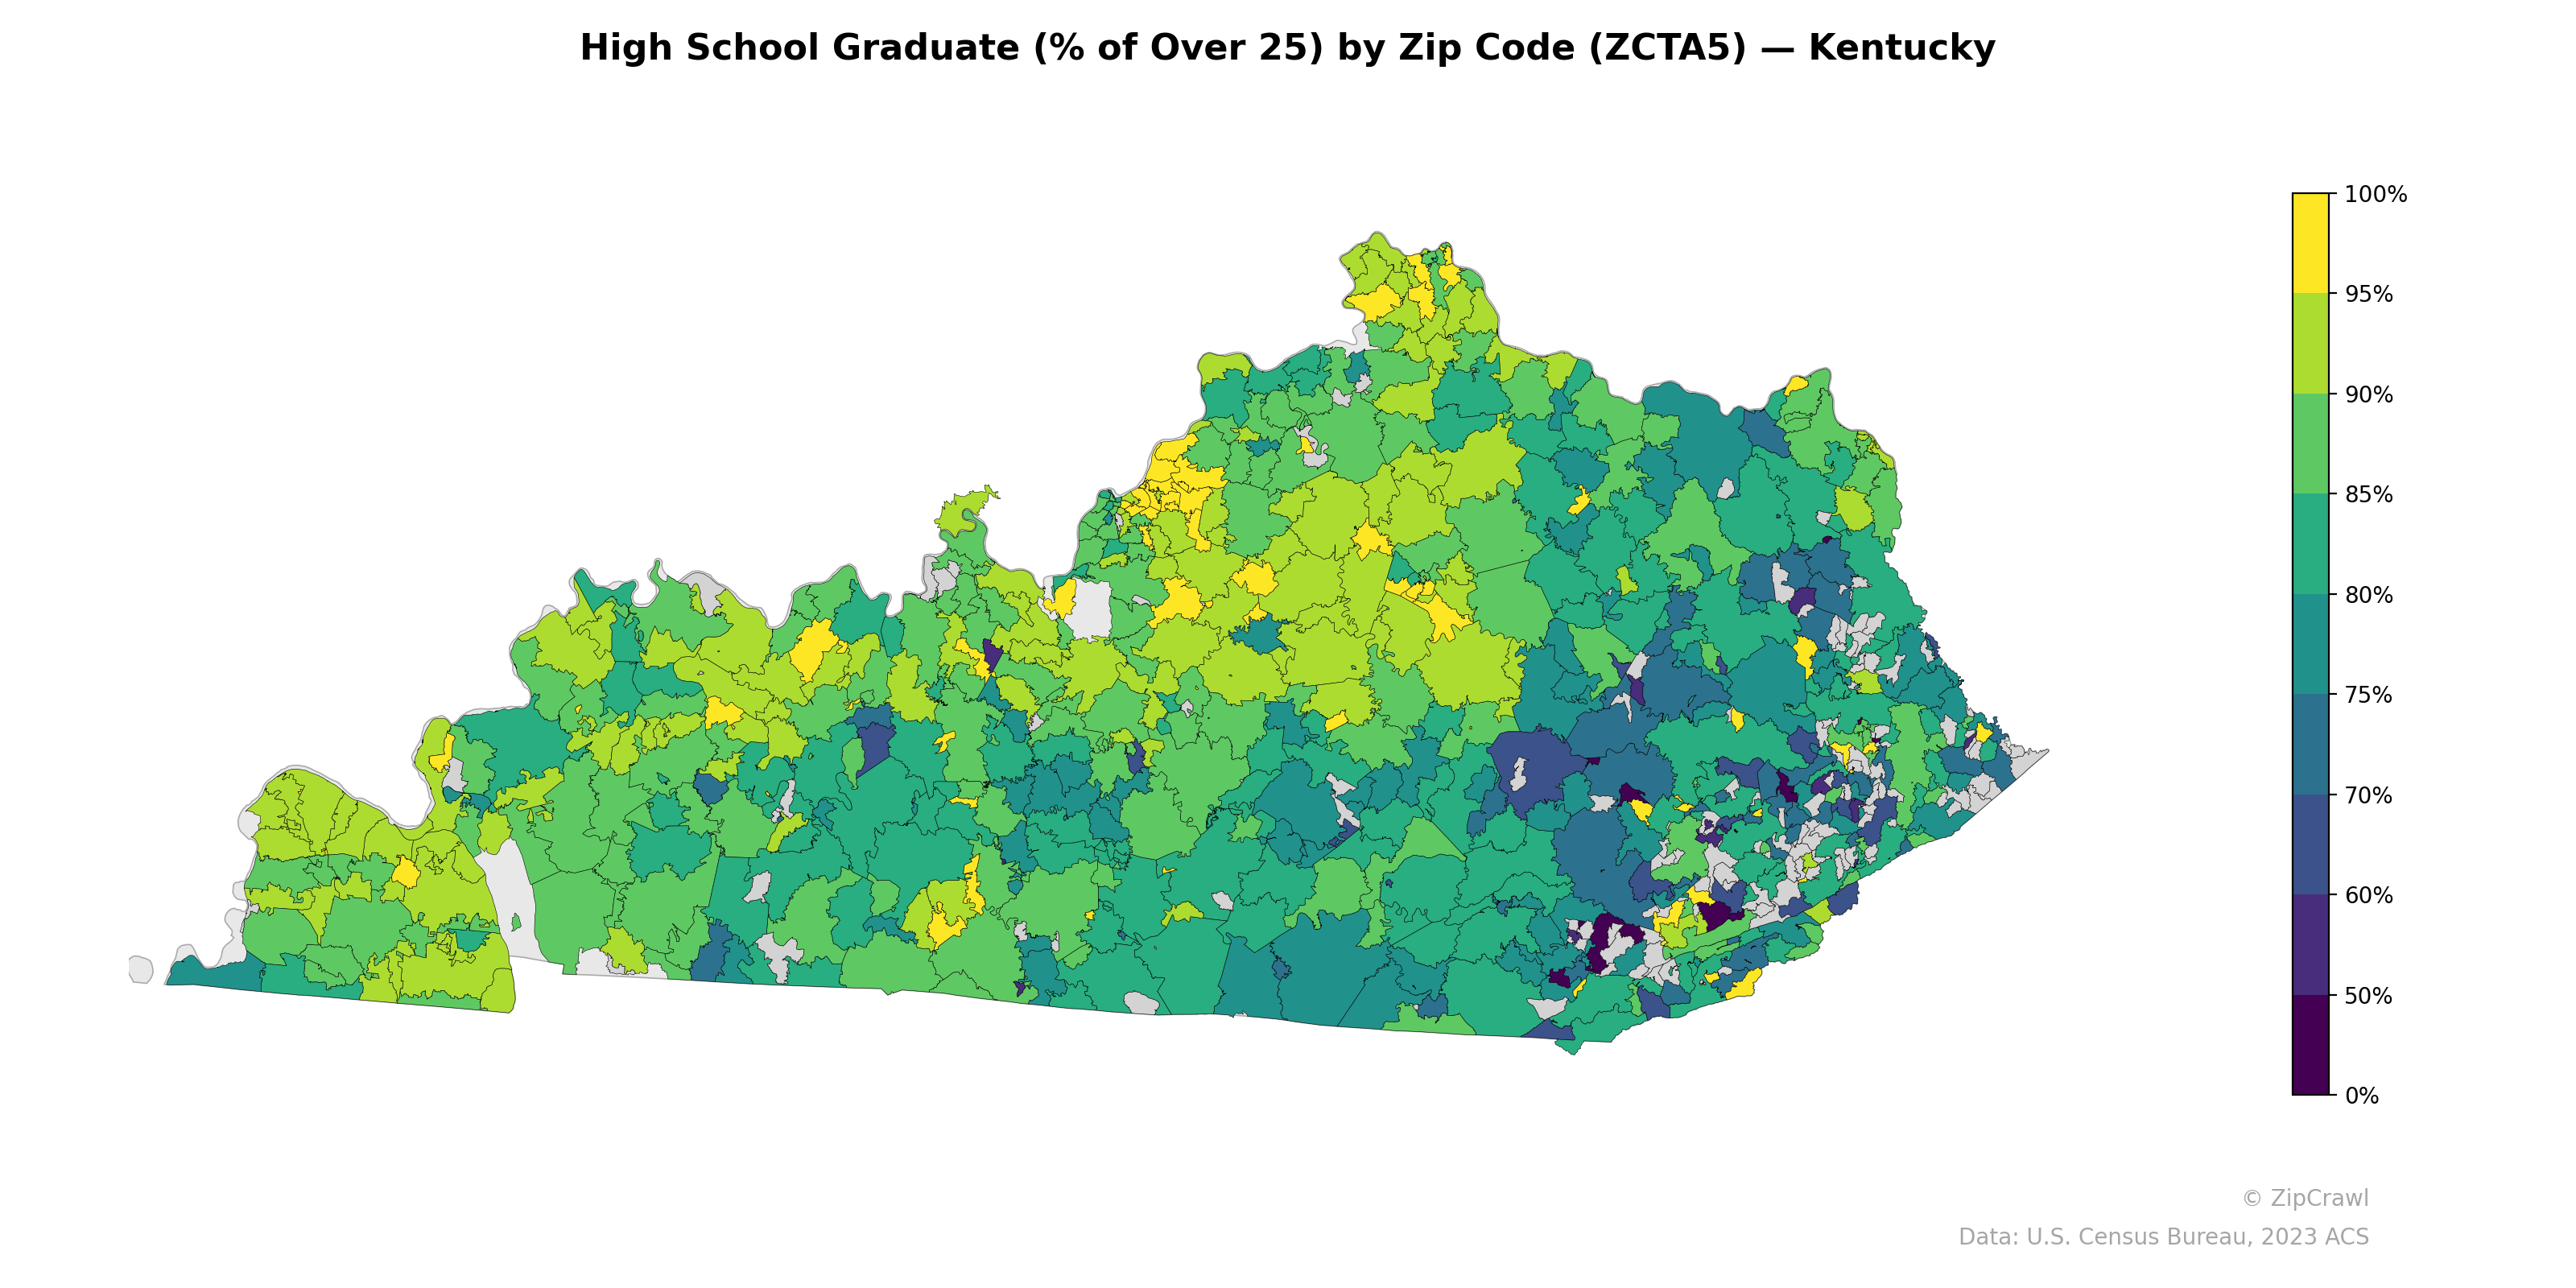
NOTE: Gray indicates insufficient data or a suppressed estimate.
High school graduation rates across Kentucky exhibit a pronounced east-west divide, with the southeastern Appalachian region—particularly zip codes in counties like Owsley, Lee, Breathitt, and Letcher—displaying markedly lower attainment levels, frequently falling below 60-70%. The western and north-central portions of the state, including areas around Louisville and the Purchase region, generally sustain graduation rates above 80-85%, with several suburban zip codes reaching above 95%. Scattered bright yellow pockets near Lexington, Louisville, and a few smaller metro areas likely correspond to affluent suburban communities, while the darkest clusters in eastern Kentucky represent some of the lowest educational attainment rates in the nation.
Data: U.S. Census Bureau, 2023 ACS
Explore
- Median Age by Zip Code (ZCTA5) — California
- Population Non-Hispanic American Indian % by Zip Code (ZCTA5) — Kentucky
- Housing % of Units Built Since 2010, by Zip Code (ZCTA5) — Kentucky
- Bachelor's Degree or Higher (% of Over 25) by Zip Code (ZCTA5) — Kentucky
- Household Average Size by Zip Code (ZCTA5) — Kentucky
- Housing Owner-Occupied % of Units, by Zip Code (ZCTA5) — Kentucky
- % of Households with Broadband Internet, by Zip Code (ZCTA5) — Kentucky
- Housing Median Monthly Rent ($), by Zip Code (ZCTA5) — Kentucky
- % of Population without Health Insurance, by Zip Code (ZCTA5) — Kentucky
- Housing Owner-Occupied Median Value ($), by Zip Code (ZCTA5) — Kentucky
- % of Households with Broadband Internet, by County
- Population Non-Hispanic American Indian % by Zip Code (ZCTA5) — California
- Population Non-Hispanic Black % by Zip Code (ZCTA5) — California
- Population Non-Hispanic White % by Zip Code (ZCTA5) — California
- Population Hispanic % by Zip Code (ZCTA5) — California
- Population Non-Hispanic Asian % by Zip Code (ZCTA5) — Texas
- U.S. Citizens (% of Population Over 18) by Zip Code (ZCTA5) — California
- % of Population on Food Stamps or SNAP (Last 12 Months), by Zip Code (ZCTA5) — Texas
- Household Median Income by Zip Code (ZCTA5) — California
- % of Population on Food Stamps or SNAP (Last 12 Months), by Zip Code (ZCTA5) — Florida
- Housing Median Monthly Rent ($), by Zip Code (ZCTA5) — Alabama
- Housing Owner-Occupied Median Value ($), by Zip Code (ZCTA5) — Alabama
- Housing % of Units Built Since 2010, by Zip Code (ZCTA5) — Alabama
- % of Households with Broadband Internet, by Zip Code (ZCTA5) — Alabama
- Married Couple (% of all Households) by Zip Code (ZCTA5) — Alabama
- Population Non-Hispanic Asian % by Zip Code (ZCTA5) — Alabama
- % of Population without Health Insurance, by Zip Code (ZCTA5) — Alabama
- Housing Owner-Occupied % of Units, by Zip Code (ZCTA5) — Alabama
- Household Average Size by Zip Code (ZCTA5) — Alabama
- Housing Vacancy Rate by Zip Code (ZCTA5) — Alabama
- High School Graduate (% of Over 25) by Zip Code (ZCTA5) — Ohio
- High School Graduate (% of Over 25) by Zip Code (ZCTA5) — Kansas
- High School Graduate (% of Over 25) by Zip Code (ZCTA5) — Iowa
- High School Graduate (% of Over 25) by Zip Code (ZCTA5) — Utah
- High School Graduate (% of Over 25) by Zip Code (ZCTA5) — Texas
- High School Graduate (% of Over 25) by Zip Code (ZCTA5) — Colorado
- High School Graduate (% of Over 25) by Zip Code (ZCTA5) — Idaho
- High School Graduate (% of Over 25) by Zip Code (ZCTA5) — Oregon
- High School Graduate (% of Over 25) by Zip Code (ZCTA5) — Hawaii
- High School Graduate (% of Over 25) by Zip Code (ZCTA5) — Maine