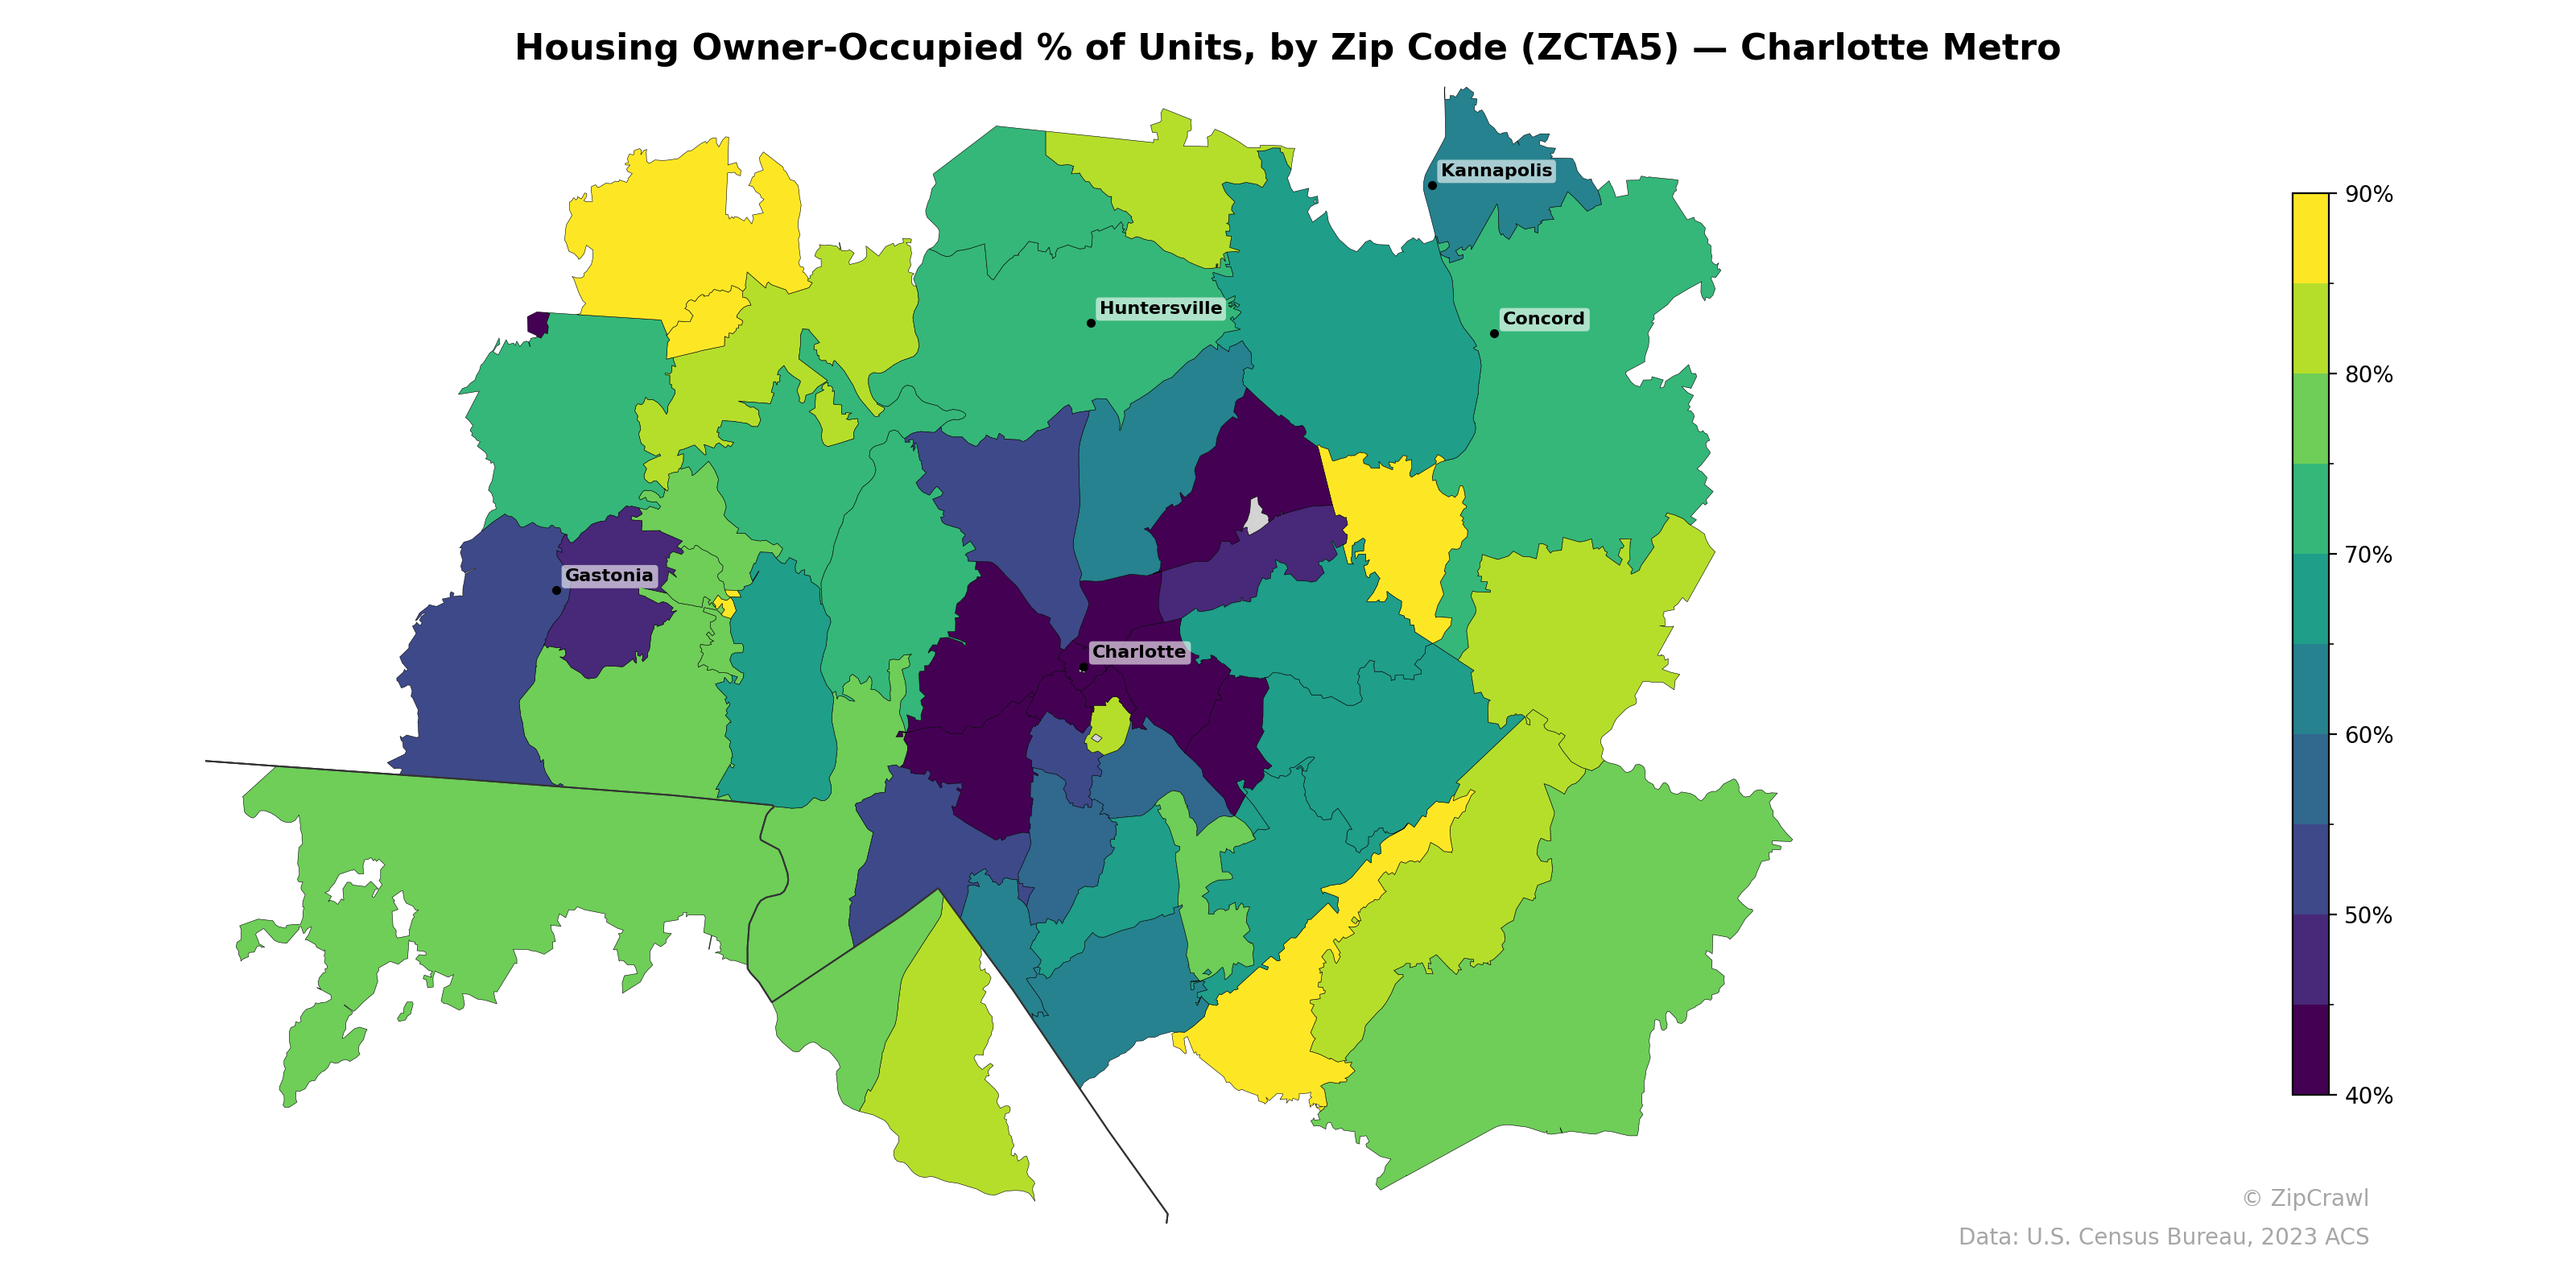
NOTE: Gray indicates insufficient data or a suppressed estimate.
Owner-occupancy rates in the Charlotte metro follow a clear core-periphery pattern, with the lowest concentrations (below 50%) clustered in central Charlotte zip codes and parts of Gastonia, while suburban and exurban areas to the north, east, and south consistently exceed 75–90%. The northeastern corridor through Huntersville, Kannapolis, and Concord maintains solidly high ownership rates in the 70–85% range, contrasting sharply with a band of renter-heavy zip codes running through Charlotte's urban core. Notable pockets of high ownership (approaching 90%) appear in the outermost rural zip codes to the northwest and southeast, as well as in select yellow-shaded areas east of Charlotte, suggesting newer suburban residential development.
Data: U.S. Census Bureau, 2023 ACS
Explore
- Housing Vacancy Rate by Zip Code (ZCTA5) — Chicago Metro
- Housing Vacancy Rate by Zip Code (ZCTA5) — Charlotte Metro
- Housing % of Units Built Since 2010, by Zip Code (ZCTA5) — Charlotte Metro
- % of Population without Health Insurance, by Zip Code (ZCTA5) — Charlotte Metro
- Married Couple (% of all Households) by Zip Code (ZCTA5) — Charlotte Metro
- Household Average Size by Zip Code (ZCTA5) — Charlotte Metro
- % of Households with Broadband Internet, by Zip Code (ZCTA5) — Charlotte Metro
- Housing Median Monthly Rent ($), by Zip Code (ZCTA5) — Charlotte Metro
- Bachelor's Degree or Higher (% of Over 25) by Zip Code (ZCTA5) — Charlotte Metro
- Housing Owner-Occupied Median Value ($), by Zip Code (ZCTA5) — Charlotte Metro
- Population Non-Hispanic American Indian % by County
- Household Average Size by Zip Code (ZCTA5) — Chicago Metro
- Housing Median Monthly Rent ($), by Zip Code (ZCTA5) — Chicago Metro
- Married Couple (% of all Households) by Zip Code (ZCTA5) — Chicago Metro
- Bachelor's Degree or Higher (% of Over 25) by Zip Code (ZCTA5) — Chicago Metro
- % of Population without Health Insurance, by Zip Code (ZCTA5) — Chicago Metro
- Housing Owner-Occupied Median Value ($), by Zip Code (ZCTA5) — Chicago Metro
- % of Households with Broadband Internet, by Zip Code (ZCTA5) — Chicago Metro
- Housing % of Units Built Since 2010, by Zip Code (ZCTA5) — Chicago Metro
- Married Couple (% of all Households) by Zip Code (ZCTA5) — Denver Metro
- Housing % of Units Built Since 2010, by Zip Code (ZCTA5) — Denver Metro
- Housing Vacancy Rate by Zip Code (ZCTA5) — Denver Metro
- High School Graduate (% of Over 25) by Zip Code (ZCTA5) — Denver Metro
- % of Households with Broadband Internet, by Zip Code (ZCTA5) — Denver Metro
- Population Non-Hispanic Black % by Zip Code (ZCTA5) — Denver Metro
- Bachelor's Degree or Higher (% of Over 25) by Zip Code (ZCTA5) — Denver Metro
- Population Hispanic % by Zip Code (ZCTA5) — Denver Metro
- Housing Owner-Occupied Median Value ($), by Zip Code (ZCTA5) — Denver Metro
- Household Average Size by Zip Code (ZCTA5) — Denver Metro
- Population Non-Hispanic American Indian % by Zip Code (ZCTA5) — Denver Metro
- Housing Owner-Occupied % of Units, by Zip Code (ZCTA5) — Houston Metro
- Housing Owner-Occupied % of Units, by Zip Code (ZCTA5) — Chicago Metro
- Housing Owner-Occupied % of Units, by Zip Code (ZCTA5) — Miami Metro
- Housing Owner-Occupied % of Units, by Zip Code (ZCTA5) — Detroit Metro
- Housing Owner-Occupied % of Units, by Zip Code (ZCTA5) — Boston Metro
- Housing Owner-Occupied % of Units, by Zip Code (ZCTA5) — Tampa Metro
- Housing Owner-Occupied % of Units, by Zip Code (ZCTA5) — Denver Metro
- Housing Owner-Occupied % of Units, by Zip Code (ZCTA5) — Dallas Metro
- Housing Owner-Occupied % of Units, by Zip Code (ZCTA5) — Orlando Metro
- Housing Owner-Occupied % of Units, by Zip Code (ZCTA5) — Austin Metro