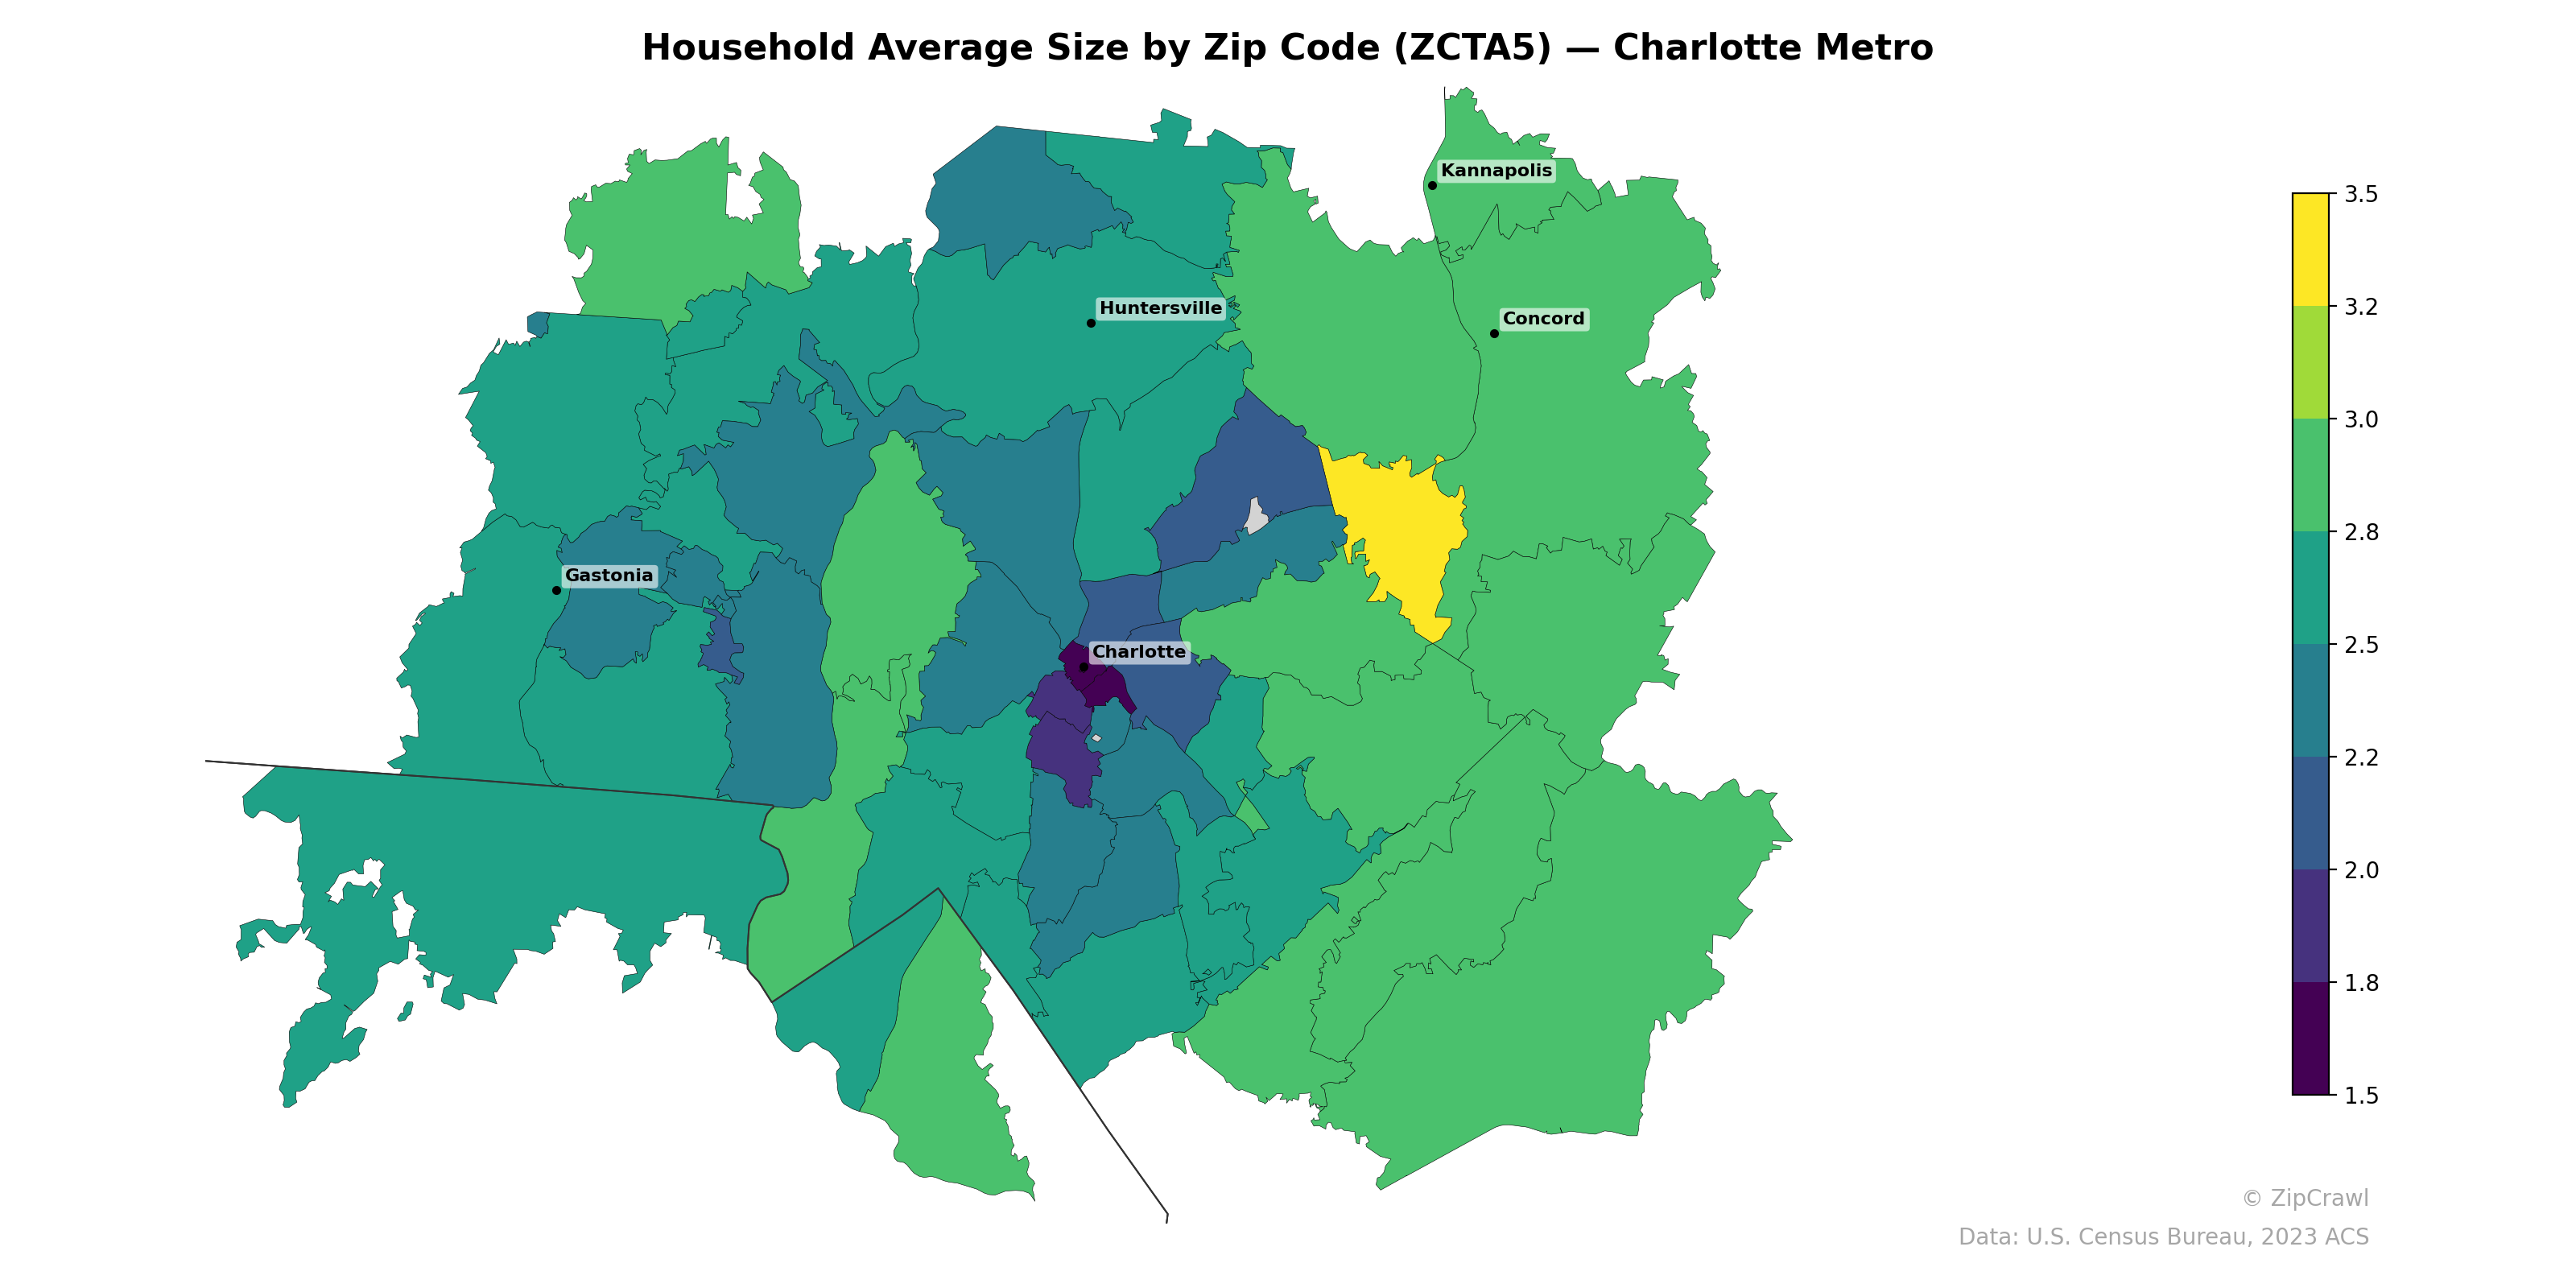
NOTE: Gray indicates insufficient data or a suppressed estimate.
The largest average household sizes in the Charlotte metro concentrate in a distinct cluster northeast of the city center, with one zip code between Huntersville and Concord reaching approximately 3.5 persons per household, likely reflecting newer suburban family-oriented developments. Downtown Charlotte and its immediate surroundings exhibit the smallest household sizes—dropping to roughly 1.5–1.8—consistent with a high concentration of apartments, condos, and single-occupant housing typical of urban cores. The outer suburban and exurban ring, including areas around Gastonia, Kannapolis, and south Charlotte, generally maintains moderate household sizes between 2.4 and 3.0, suggesting a mix of established single-family neighborhoods and moderate-density housing.
Data: U.S. Census Bureau, 2023 ACS
Explore
- Housing Vacancy Rate by Zip Code (ZCTA5) — Chicago Metro
- Housing Vacancy Rate by Zip Code (ZCTA5) — Charlotte Metro
- % of Population without Health Insurance, by Zip Code (ZCTA5) — Charlotte Metro
- Bachelor's Degree or Higher (% of Over 25) by Zip Code (ZCTA5) — Charlotte Metro
- Married Couple (% of all Households) by Zip Code (ZCTA5) — Charlotte Metro
- Housing Owner-Occupied % of Units, by Zip Code (ZCTA5) — Charlotte Metro
- Housing Median Monthly Rent ($), by Zip Code (ZCTA5) — Charlotte Metro
- Housing Owner-Occupied Median Value ($), by Zip Code (ZCTA5) — Charlotte Metro
- Housing % of Units Built Since 2010, by Zip Code (ZCTA5) — Charlotte Metro
- % of Households with Broadband Internet, by Zip Code (ZCTA5) — Charlotte Metro
- Population Non-Hispanic American Indian % by County
- Housing Owner-Occupied Median Value ($), by Zip Code (ZCTA5) — Chicago Metro
- Married Couple (% of all Households) by Zip Code (ZCTA5) — Chicago Metro
- Housing Owner-Occupied % of Units, by Zip Code (ZCTA5) — Chicago Metro
- Housing Median Monthly Rent ($), by Zip Code (ZCTA5) — Chicago Metro
- Bachelor's Degree or Higher (% of Over 25) by Zip Code (ZCTA5) — Chicago Metro
- Housing % of Units Built Since 2010, by Zip Code (ZCTA5) — Chicago Metro
- % of Households with Broadband Internet, by Zip Code (ZCTA5) — Chicago Metro
- % of Population without Health Insurance, by Zip Code (ZCTA5) — Chicago Metro
- Housing % of Units Built Since 2010, by Zip Code (ZCTA5) — Denver Metro
- Housing Owner-Occupied % of Units, by Zip Code (ZCTA5) — Denver Metro
- Married Couple (% of all Households) by Zip Code (ZCTA5) — Denver Metro
- Population Non-Hispanic American Indian % by Zip Code (ZCTA5) — Denver Metro
- Bachelor's Degree or Higher (% of Over 25) by Zip Code (ZCTA5) — Denver Metro
- Population Hispanic % by Zip Code (ZCTA5) — Denver Metro
- High School Graduate (% of Over 25) by Zip Code (ZCTA5) — Denver Metro
- Population Non-Hispanic White % by Zip Code (ZCTA5) — Denver Metro
- % of Population without Health Insurance, by Zip Code (ZCTA5) — Denver Metro
- Housing Owner-Occupied Median Value ($), by Zip Code (ZCTA5) — Denver Metro
- Population Non-Hispanic Black % by Zip Code (ZCTA5) — Denver Metro
- Household Average Size by Zip Code (ZCTA5) — Houston Metro
- Household Average Size by Zip Code (ZCTA5) — Chicago Metro
- Household Average Size by Zip Code (ZCTA5) — Miami Metro
- Household Average Size by Zip Code (ZCTA5) — Denver Metro
- Household Average Size by Zip Code (ZCTA5) — Detroit Metro
- Household Average Size by Zip Code (ZCTA5) — Austin Metro
- Household Average Size by Zip Code (ZCTA5) — Tampa Metro
- Household Average Size by Zip Code (ZCTA5) — Boston Metro
- Household Average Size by Zip Code (ZCTA5) — Atlanta Metro
- Household Average Size by Zip Code (ZCTA5) — Dallas Metro