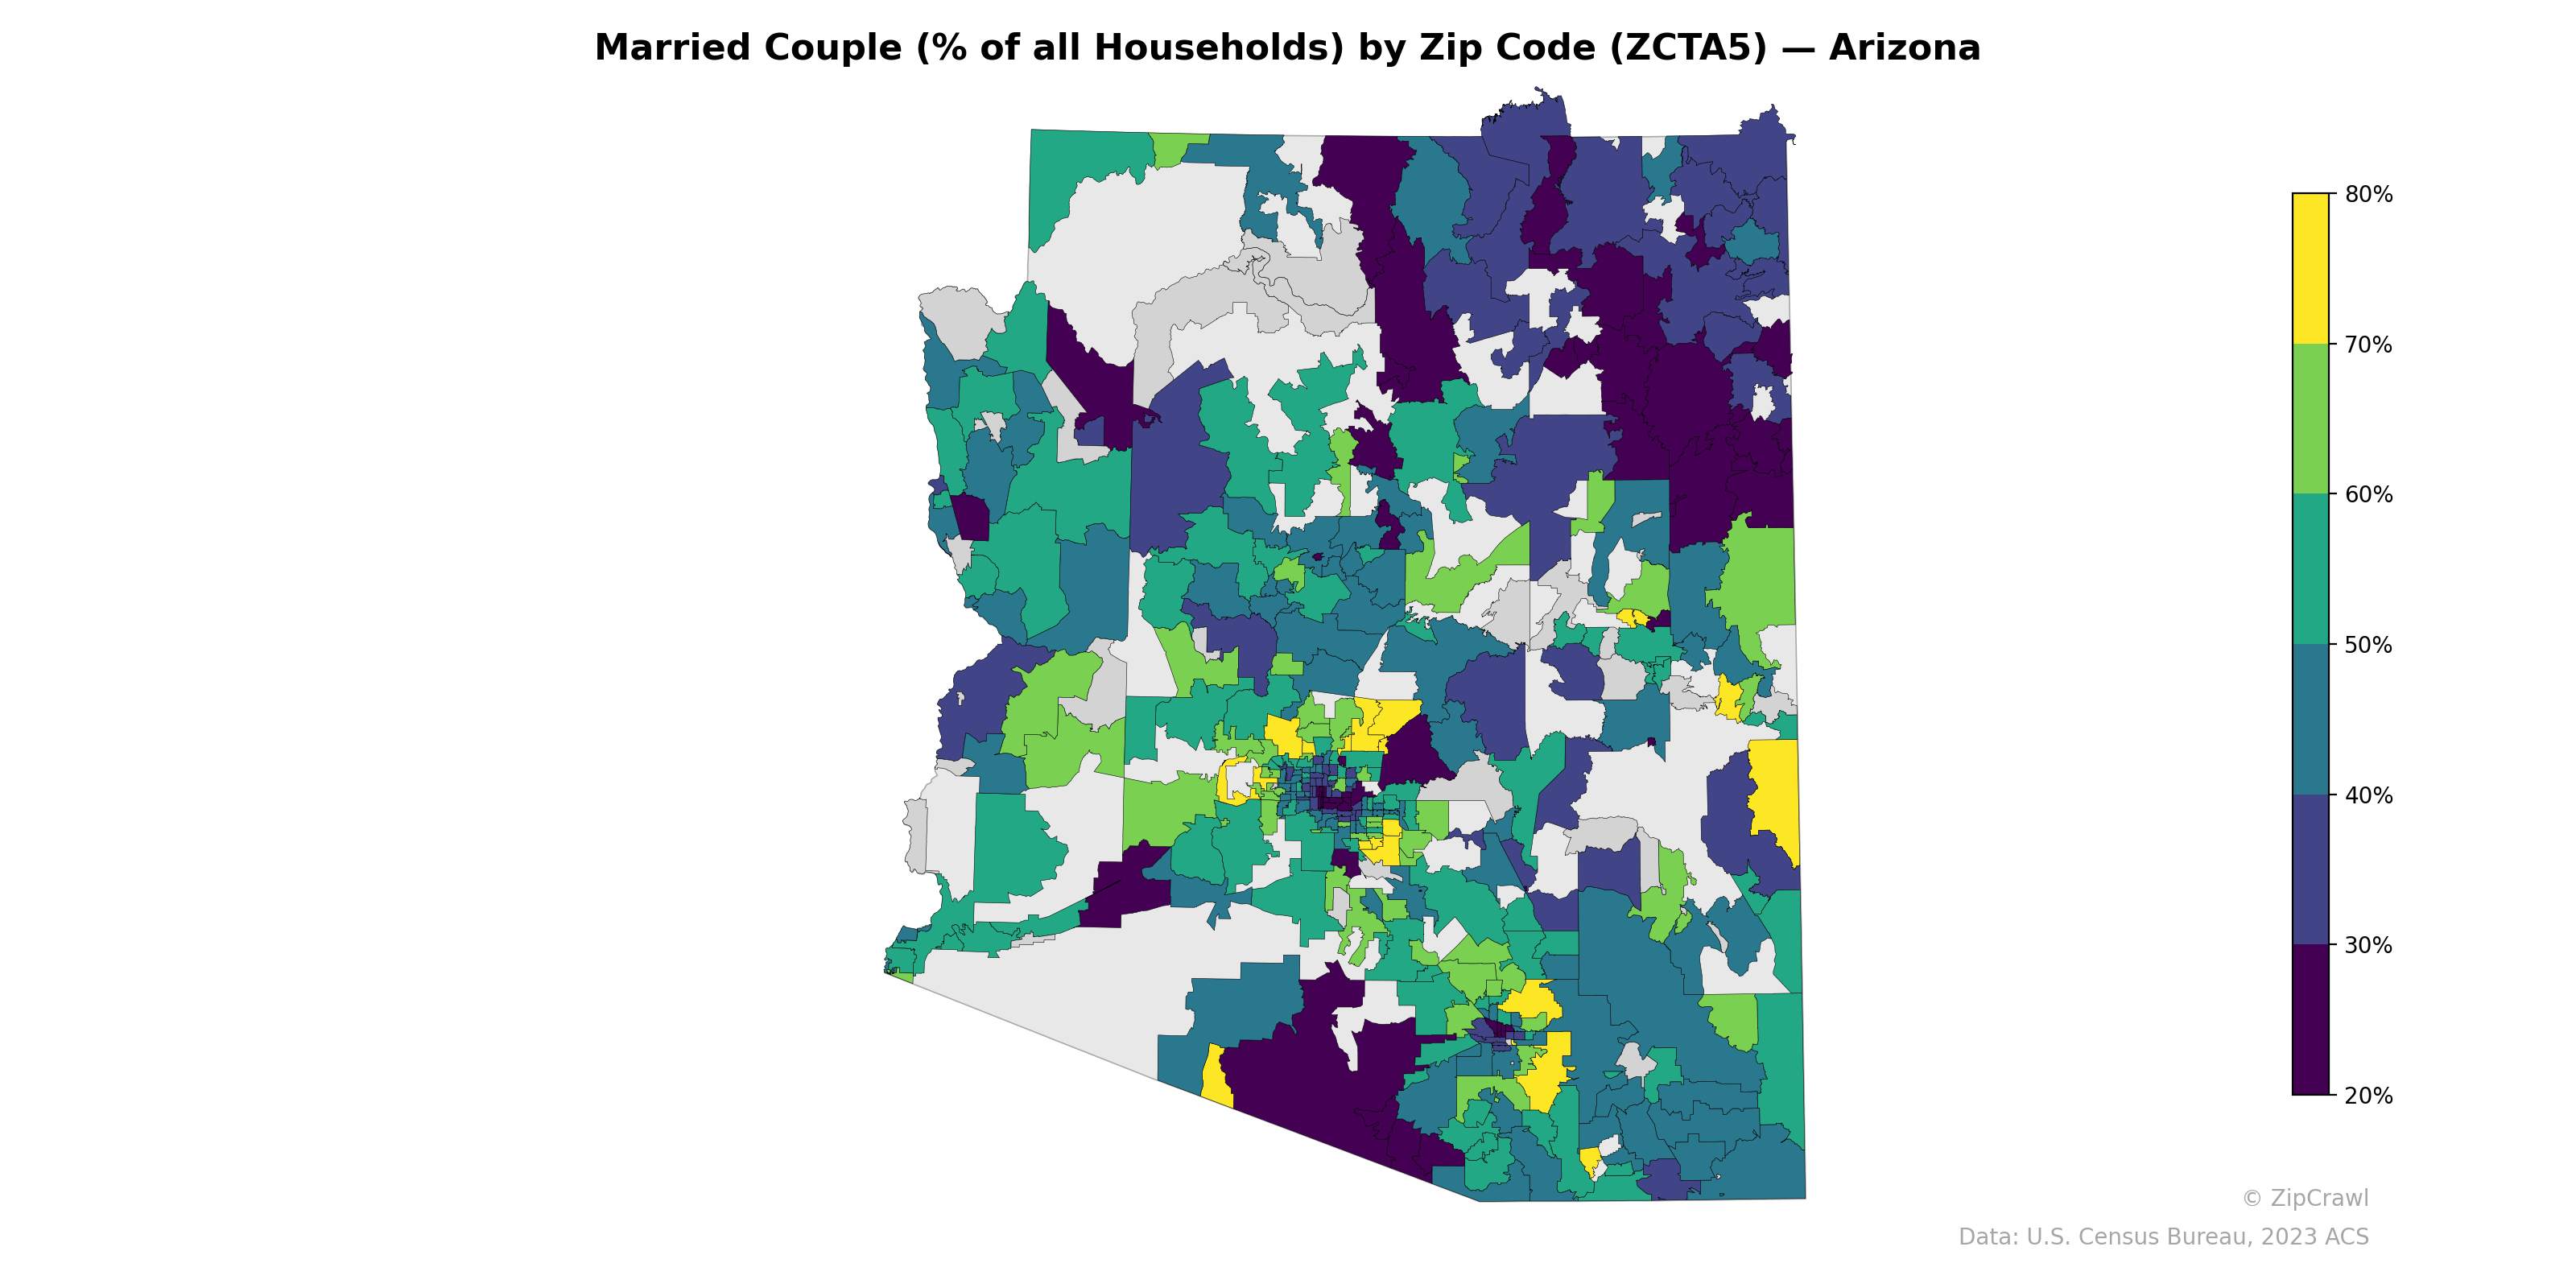
NOTE: Gray indicates insufficient data or a suppressed estimate.
Suburban zip codes ringing the Phoenix metropolitan area—particularly to the northeast in areas consistent with Scottsdale, Fountain Hills, and Gilbert—display married-couple household rates of 60–80%, while central Phoenix and Tucson urban cores fall markedly lower, often below 30%. Northern Arizona exhibits significant heterogeneity, with tribal nation zip codes and rural areas in the northeast showing some of the lowest rates statewide alongside pockets of higher rates near Flagstaff's outer suburbs. The southeast corner of the state and areas along the western border near Yuma also trend toward lower married-couple percentages, contrasting with the consistently elevated rates in Arizona's affluent exurban corridors.
Data: U.S. Census Bureau, 2023 ACS
Explore
- High School Graduate (% of Over 25) by Zip Code (ZCTA5) — Los Angeles Metro
- Household Average Size by Zip Code (ZCTA5) — Arizona
- Bachelor's Degree or Higher (% of Over 25) by Zip Code (ZCTA5) — Arizona
- Housing Median Monthly Rent ($), by Zip Code (ZCTA5) — Arizona
- % of Population without Health Insurance, by Zip Code (ZCTA5) — Arizona
- Housing % of Units Built Since 2010, by Zip Code (ZCTA5) — Arizona
- Housing Vacancy Rate by Zip Code (ZCTA5) — Arizona
- Housing Owner-Occupied % of Units, by Zip Code (ZCTA5) — Arizona
- % of Households with Broadband Internet, by Zip Code (ZCTA5) — Arizona
- Housing Owner-Occupied Median Value ($), by Zip Code (ZCTA5) — Arizona
- Population Hispanic % by Zip Code (ZCTA5) — Rhode Island
- Population Hispanic % by County
- Population Non-Hispanic American Indian % by Zip Code (ZCTA5) — Los Angeles Metro
- Median Age by Zip Code (ZCTA5) — Los Angeles Metro
- Population Hispanic % by Zip Code (ZCTA5) — Los Angeles Metro
- % of Population on Food Stamps or SNAP (Last 12 Months), by Zip Code (ZCTA5) — New York Metro
- Population Non-Hispanic Black % by Zip Code (ZCTA5) — Los Angeles Metro
- U.S. Citizens (% of Population Over 18) by Zip Code (ZCTA5) — Los Angeles Metro
- Household Median Income by Zip Code (ZCTA5) — Los Angeles Metro
- Population Non-Hispanic White % by Zip Code (ZCTA5) — Los Angeles Metro
- Housing % of Units Built Since 2010, by Zip Code (ZCTA5) — Virginia
- Housing Owner-Occupied Median Value ($), by Zip Code (ZCTA5) — Virginia
- Household Average Size by Zip Code (ZCTA5) — Virginia
- High School Graduate (% of Over 25) by Zip Code (ZCTA5) — Virginia
- Population Non-Hispanic American Indian % by Zip Code (ZCTA5) — Virginia
- Bachelor's Degree or Higher (% of Over 25) by Zip Code (ZCTA5) — Virginia
- % of Population without Health Insurance, by Zip Code (ZCTA5) — Virginia
- Housing Owner-Occupied % of Units, by Zip Code (ZCTA5) — Virginia
- Housing Median Monthly Rent ($), by Zip Code (ZCTA5) — Virginia
- Population Hispanic % by Zip Code (ZCTA5) — Virginia
- Married Couple (% of all Households) by Zip Code (ZCTA5) — Ohio
- Married Couple (% of all Households) by Zip Code (ZCTA5) — Maine
- Married Couple (% of all Households) by Zip Code (ZCTA5) — Montana
- Married Couple (% of all Households) by Zip Code (ZCTA5) — Utah
- Married Couple (% of all Households) by Zip Code (ZCTA5) — Iowa
- Married Couple (% of all Households) by Zip Code (ZCTA5) — Alaska
- Married Couple (% of all Households) by Zip Code (ZCTA5) — Arkansas
- Married Couple (% of all Households) by Zip Code (ZCTA5) — Indiana
- Married Couple (% of all Households) by Zip Code (ZCTA5) — Alabama
- Married Couple (% of all Households) by Zip Code (ZCTA5) — Texas