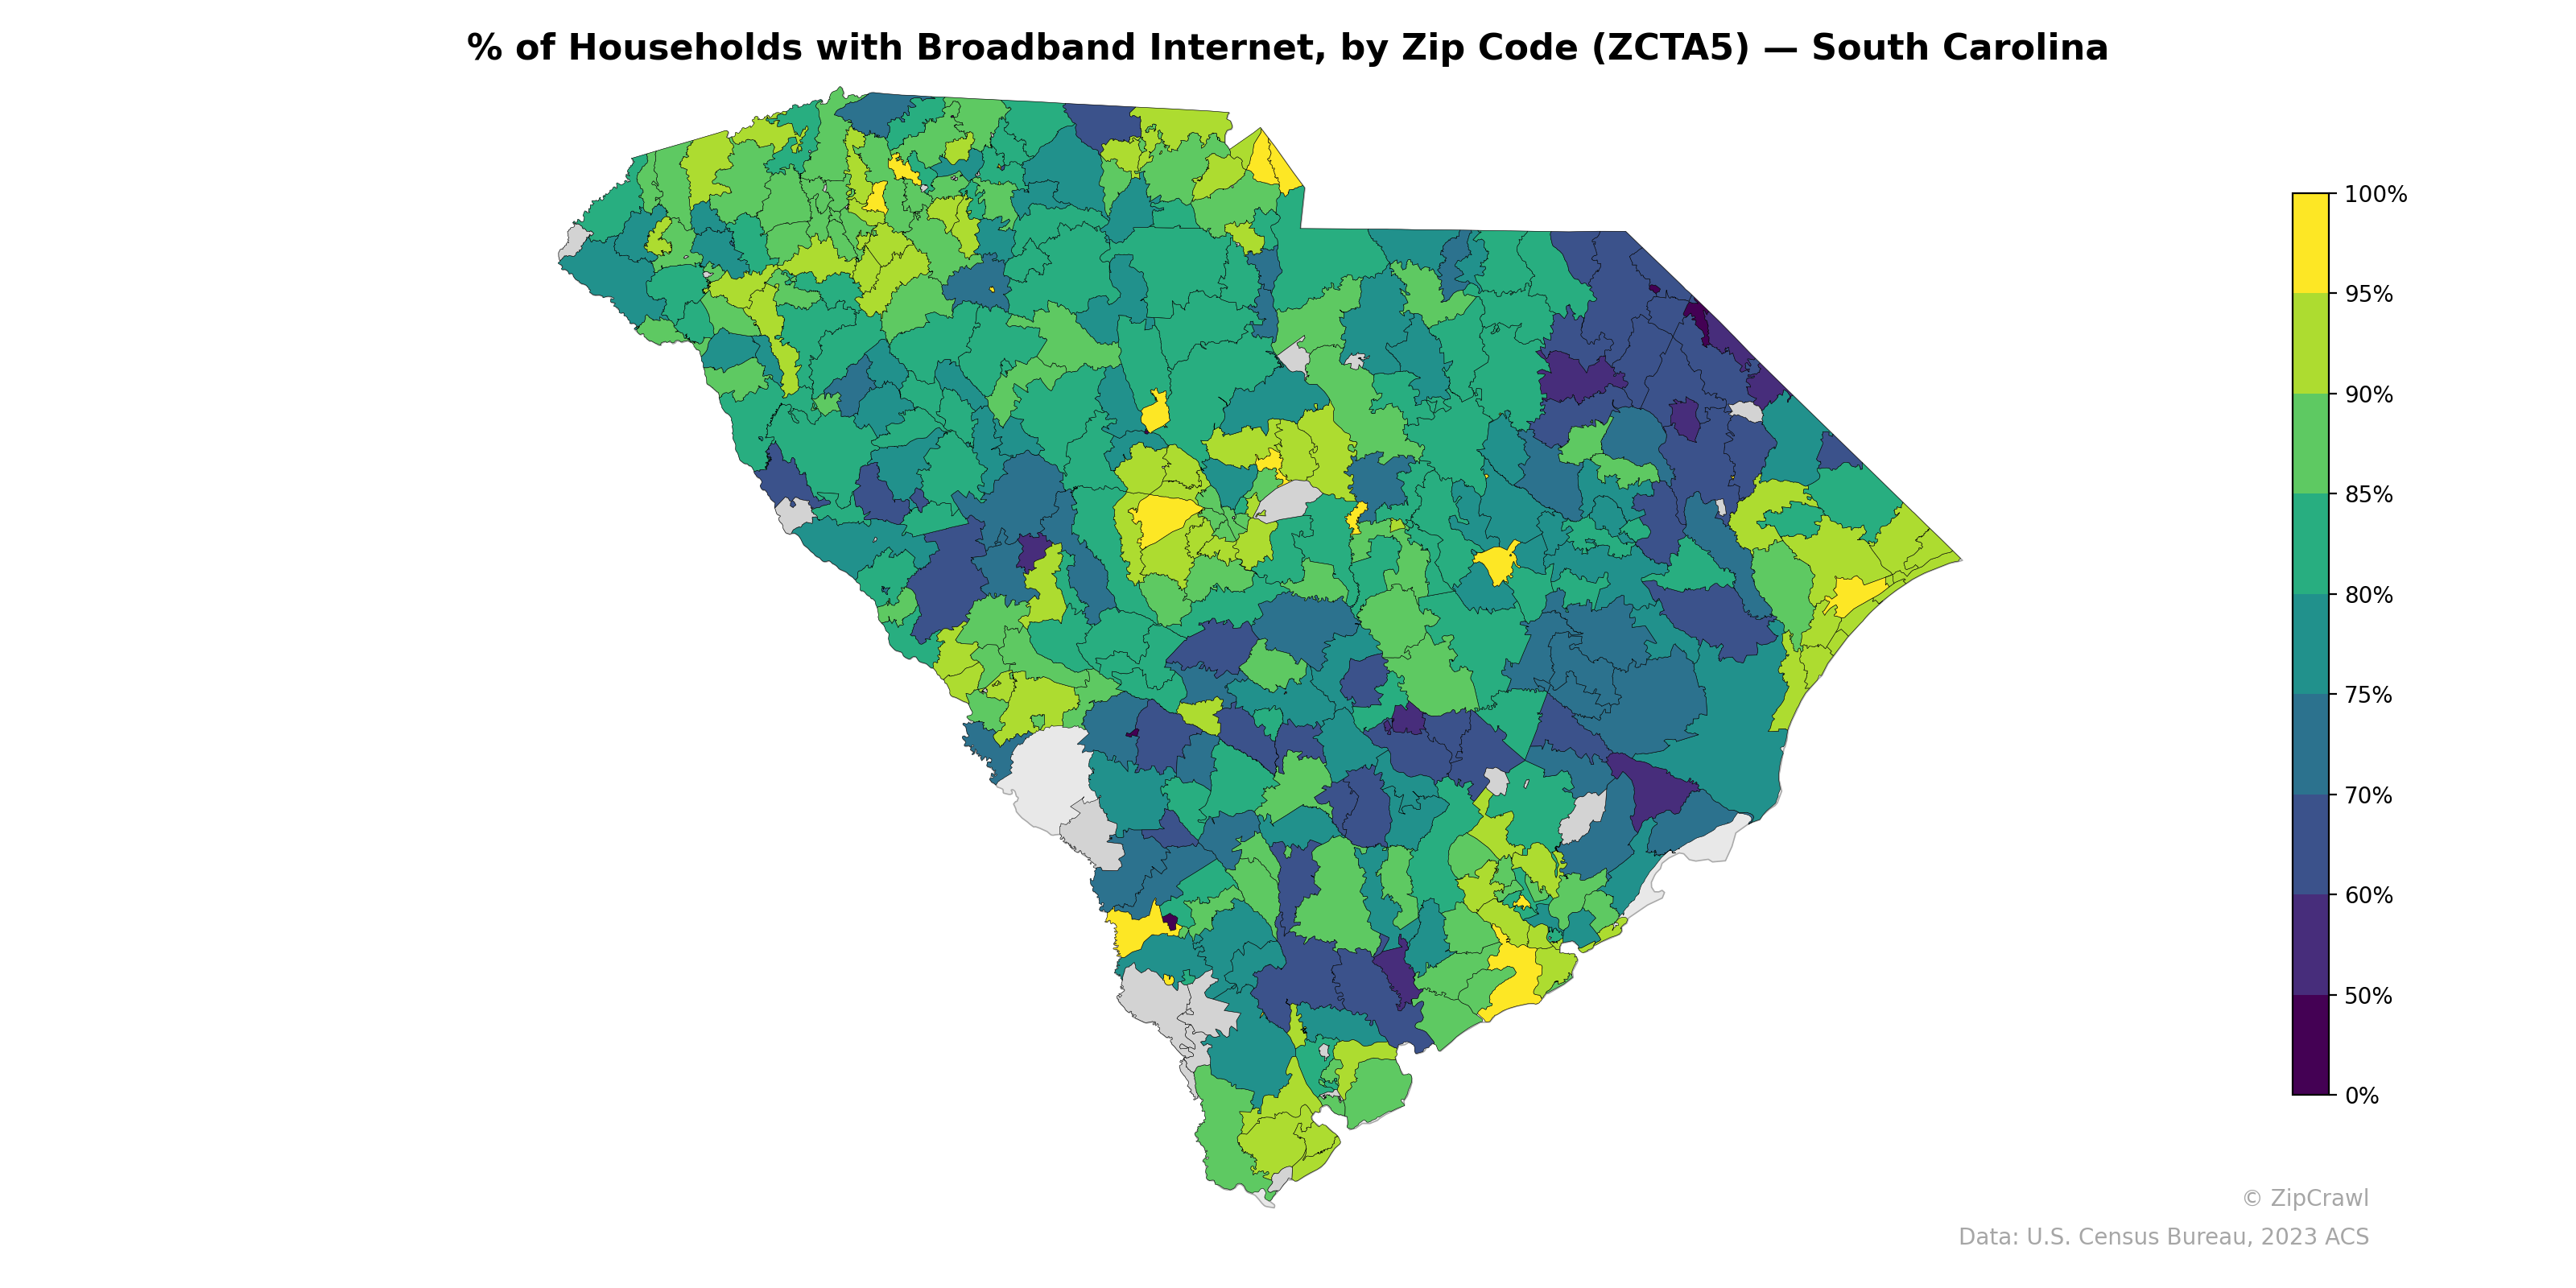
NOTE: Gray indicates insufficient data or a suppressed estimate.
Broadband adoption rates across South Carolina reveal a pronounced urban-rural divide, with zip codes in the Charlotte metro spillover area (Rock Hill/Fort Mill), the Greenville-Spartanburg corridor, and suburban Columbia consistently reaching 85–95%+ coverage, while rural zip codes in the Pee Dee region, parts of the Lowcountry, and the I-95 corridor frequently fall below 65%. A cluster of particularly low-connectivity zip codes is visible in the southeastern interior around Allendale, Hampton, and Williamsburg counties, forming a contiguous band of digital disadvantage. Coastal zip codes near Charleston, Hilton Head, and Myrtle Beach generally perform well, though pockets of lower adoption persist in adjacent rural areas just inland from the coast.
Data: U.S. Census Bureau, 2023 ACS
Explore
- Housing Owner-Occupied Median Value ($), by Zip Code (ZCTA5) — Texas
- % of Population without Health Insurance, by Zip Code (ZCTA5) — South Carolina
- Population Non-Hispanic American Indian % by Zip Code (ZCTA5) — South Carolina
- High School Graduate (% of Over 25) by Zip Code (ZCTA5) — South Carolina
- Housing Median Monthly Rent ($), by Zip Code (ZCTA5) — South Carolina
- Housing % of Units Built Since 2010, by Zip Code (ZCTA5) — South Carolina
- Housing Owner-Occupied % of Units, by Zip Code (ZCTA5) — South Carolina
- Bachelor's Degree or Higher (% of Over 25) by Zip Code (ZCTA5) — South Carolina
- Housing Owner-Occupied Median Value ($), by Zip Code (ZCTA5) — South Carolina
- Household Average Size by Zip Code (ZCTA5) — South Carolina
- Bachelor's Degree or Higher (% of Over 25) by County
- Housing Owner-Occupied % of Units, by Zip Code (ZCTA5) — Texas
- Household Average Size by Zip Code (ZCTA5) — Texas
- Married Couple (% of all Households) by Zip Code (ZCTA5) — Texas
- Housing Vacancy Rate by Zip Code (ZCTA5) — Texas
- Housing % of Units Built Since 2010, by Zip Code (ZCTA5) — Texas
- Household Median Income by Zip Code (ZCTA5) — Los Angeles Metro
- % of Population without Health Insurance, by Zip Code (ZCTA5) — Texas
- Housing Median Monthly Rent ($), by Zip Code (ZCTA5) — Texas
- Bachelor's Degree or Higher (% of Over 25) by Zip Code (ZCTA5) — Texas
- High School Graduate (% of Over 25) by Zip Code (ZCTA5) — Wisconsin
- % of Population on Food Stamps or SNAP (Last 12 Months), by Zip Code (ZCTA5) — Wisconsin
- Population Non-Hispanic Black % by Zip Code (ZCTA5) — Wisconsin
- Population Non-Hispanic White % by Zip Code (ZCTA5) — Wisconsin
- U.S. Citizens (% of Population Over 18) by Zip Code (ZCTA5) — Colorado
- Population Non-Hispanic American Indian % by Zip Code (ZCTA5) — Wisconsin
- Housing Vacancy Rate by Zip Code (ZCTA5) — Wisconsin
- Bachelor's Degree or Higher (% of Over 25) by Zip Code (ZCTA5) — Wisconsin
- Median Age by Zip Code (ZCTA5) — Wisconsin
- Population Non-Hispanic Asian % by Zip Code (ZCTA5) — Wisconsin
- % of Households with Broadband Internet, by Zip Code (ZCTA5) — North Carolina
- % of Households with Broadband Internet, by Zip Code (ZCTA5) — South Dakota
- % of Households with Broadband Internet, by Zip Code (ZCTA5) — Indiana
- % of Households with Broadband Internet, by Zip Code (ZCTA5) — Iowa
- % of Households with Broadband Internet, by Zip Code (ZCTA5) — Ohio
- % of Households with Broadband Internet, by Zip Code (ZCTA5) — Utah
- % of Households with Broadband Internet, by Zip Code (ZCTA5) — Idaho
- % of Households with Broadband Internet, by Zip Code (ZCTA5) — Montana
- % of Households with Broadband Internet, by Zip Code (ZCTA5) — Illinois
- % of Households with Broadband Internet, by Zip Code (ZCTA5) — Arizona