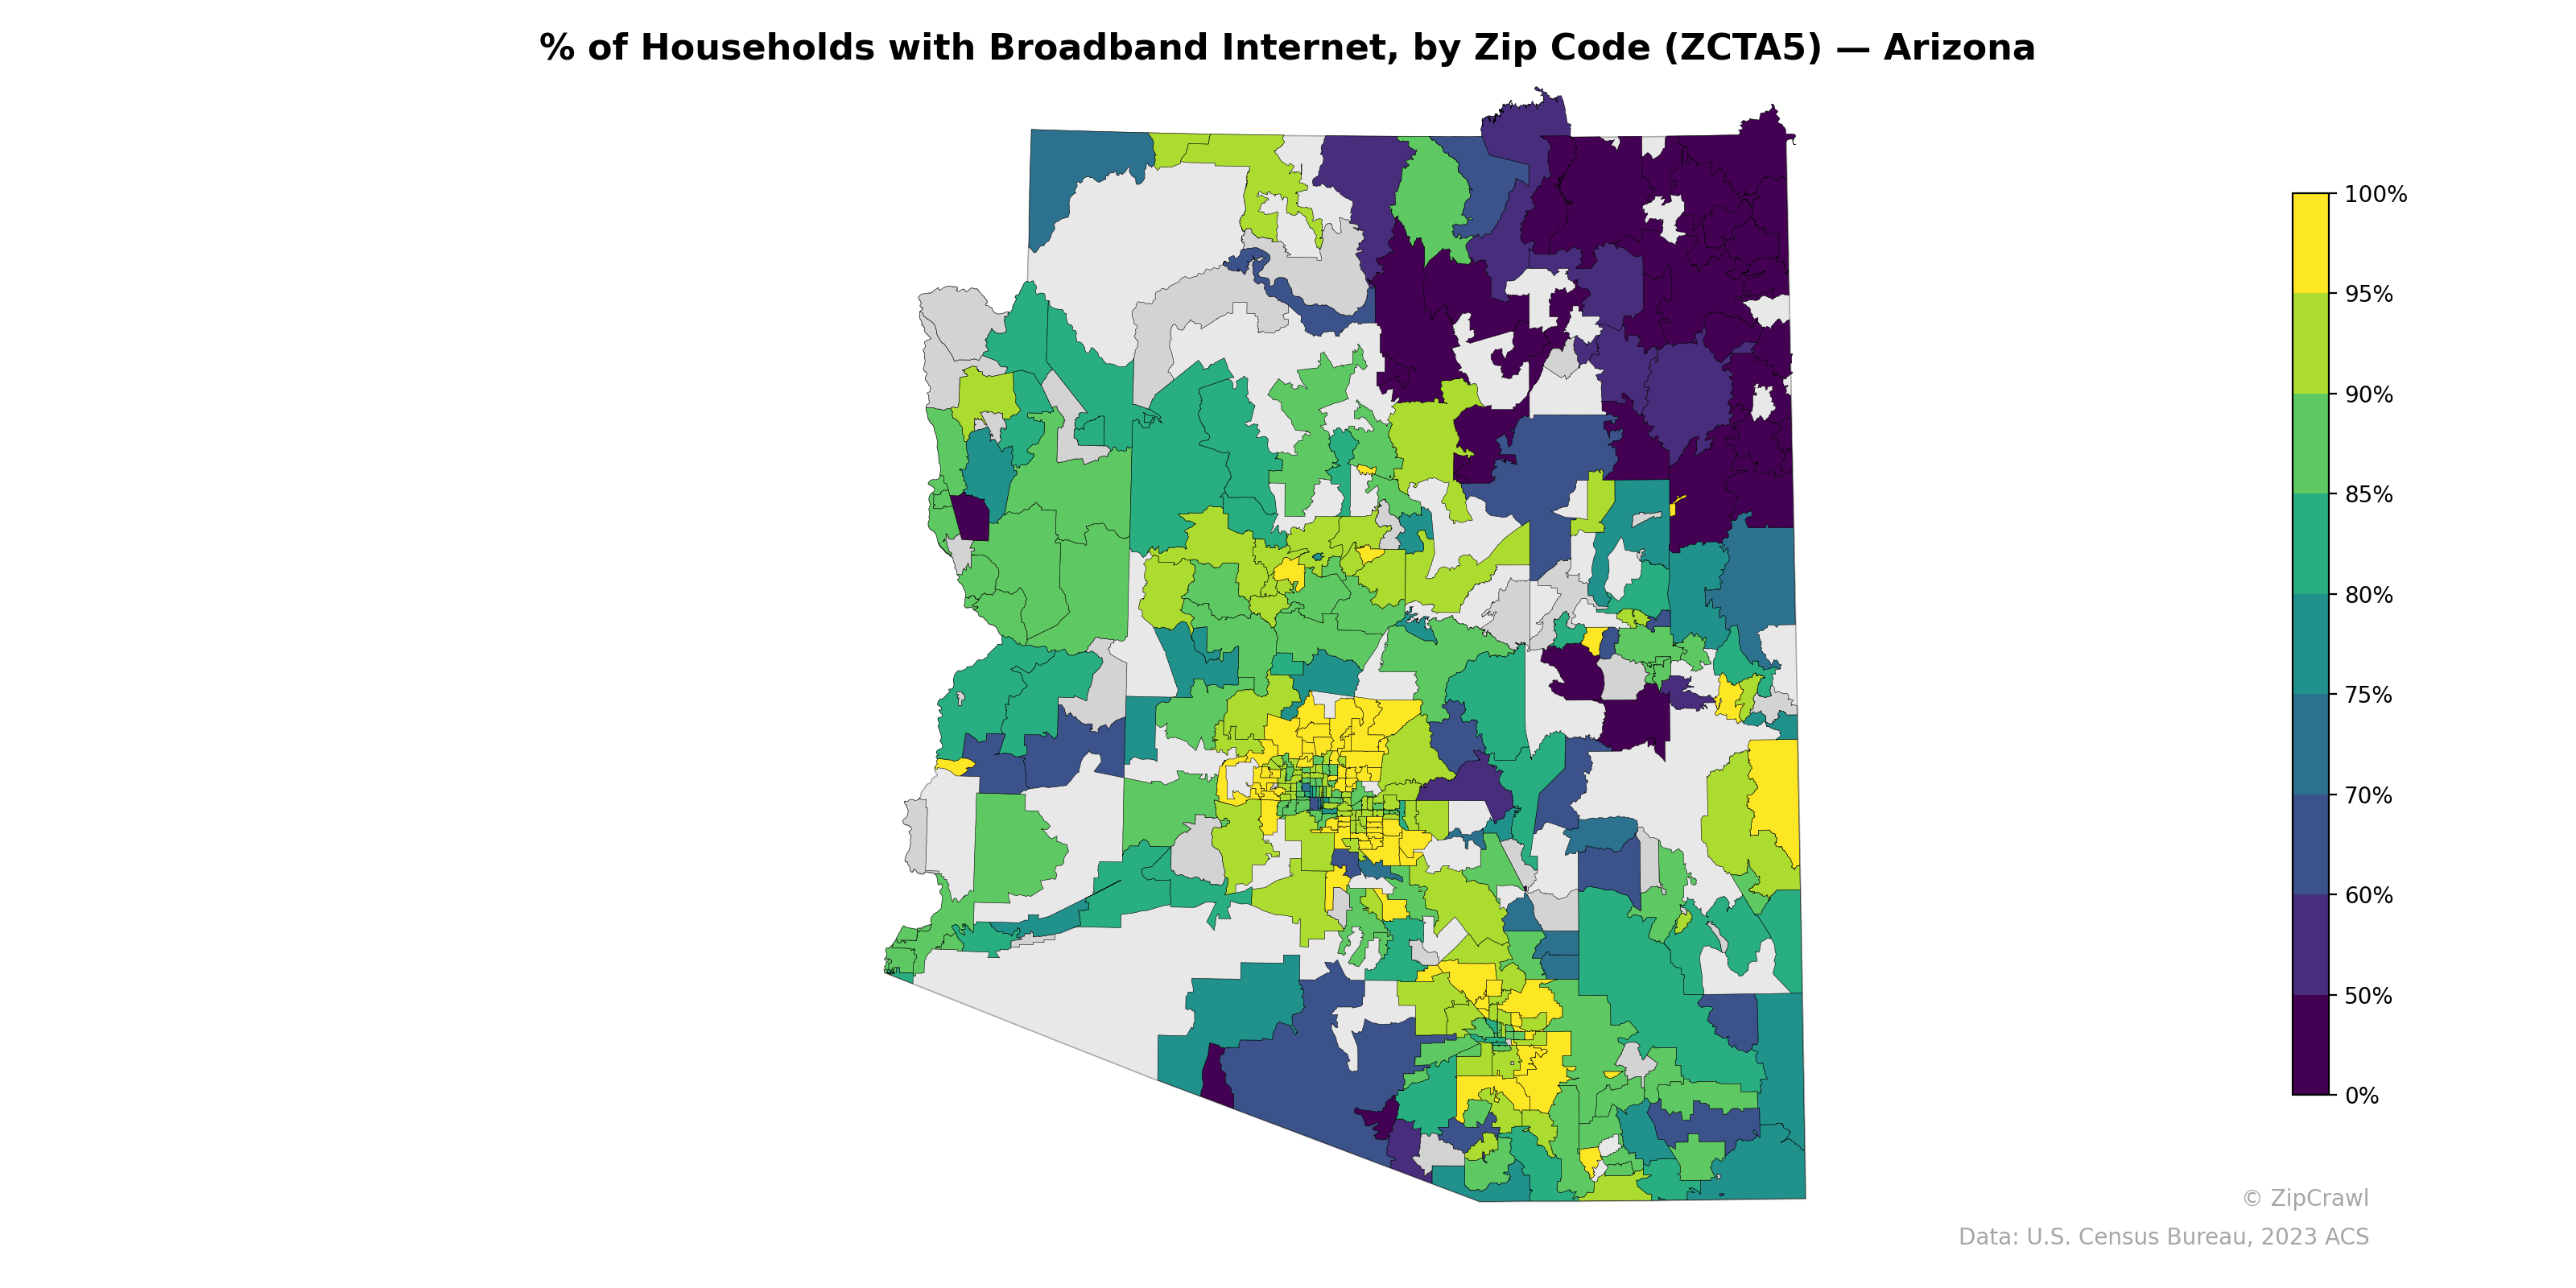
NOTE: Gray indicates insufficient data or a suppressed estimate.
Broadband adoption rates are highest in the Phoenix metropolitan area and parts of the Tucson metro, where many zip codes exceed 85–95%, reflecting dense urban infrastructure and higher household incomes. The northeastern portion of the state—encompassing much of the Navajo Nation and Apache County—displays starkly low broadband penetration, with numerous zip codes falling below 50%, highlighting persistent connectivity gaps in tribal and rural communities. A secondary band of lower adoption extends through parts of rural western and southeastern Arizona, though scattered zip codes near Flagstaff and Prescott maintain relatively strong broadband access.
Data: U.S. Census Bureau, 2023 ACS
Explore
- High School Graduate (% of Over 25) by Zip Code (ZCTA5) — Los Angeles Metro
- Married Couple (% of all Households) by Zip Code (ZCTA5) — Arizona
- Household Average Size by Zip Code (ZCTA5) — Arizona
- Housing % of Units Built Since 2010, by Zip Code (ZCTA5) — Arizona
- Housing Vacancy Rate by Zip Code (ZCTA5) — Arizona
- % of Population without Health Insurance, by Zip Code (ZCTA5) — Arizona
- Bachelor's Degree or Higher (% of Over 25) by Zip Code (ZCTA5) — Arizona
- Housing Owner-Occupied Median Value ($), by Zip Code (ZCTA5) — Arizona
- Housing Median Monthly Rent ($), by Zip Code (ZCTA5) — Arizona
- Housing Owner-Occupied % of Units, by Zip Code (ZCTA5) — Arizona
- Housing Vacancy Rate by Zip Code (ZCTA5) — Montana
- Population Hispanic % by County
- Population Non-Hispanic White % by Zip Code (ZCTA5) — Los Angeles Metro
- Population Non-Hispanic American Indian % by Zip Code (ZCTA5) — Los Angeles Metro
- % of Population on Food Stamps or SNAP (Last 12 Months), by Zip Code (ZCTA5) — New York Metro
- Median Age by Zip Code (ZCTA5) — Los Angeles Metro
- U.S. Citizens (% of Population Over 18) by Zip Code (ZCTA5) — Los Angeles Metro
- Population Non-Hispanic Black % by Zip Code (ZCTA5) — Los Angeles Metro
- Household Median Income by Zip Code (ZCTA5) — Los Angeles Metro
- Population Hispanic % by Zip Code (ZCTA5) — Los Angeles Metro
- Married Couple (% of all Households) by Zip Code (ZCTA5) — Virginia
- Housing % of Units Built Since 2010, by Zip Code (ZCTA5) — Virginia
- Housing Vacancy Rate by Zip Code (ZCTA5) — Virginia
- Bachelor's Degree or Higher (% of Over 25) by Zip Code (ZCTA5) — Virginia
- High School Graduate (% of Over 25) by Zip Code (ZCTA5) — Virginia
- % of Population without Health Insurance, by Zip Code (ZCTA5) — Virginia
- Housing Owner-Occupied Median Value ($), by Zip Code (ZCTA5) — Virginia
- Housing Median Monthly Rent ($), by Zip Code (ZCTA5) — Virginia
- Household Average Size by Zip Code (ZCTA5) — Virginia
- Population Non-Hispanic Black % by Zip Code (ZCTA5) — Virginia
- % of Households with Broadband Internet, by Zip Code (ZCTA5) — Indiana
- % of Households with Broadband Internet, by Zip Code (ZCTA5) — Iowa
- % of Households with Broadband Internet, by Zip Code (ZCTA5) — Ohio
- % of Households with Broadband Internet, by Zip Code (ZCTA5) — Arkansas
- % of Households with Broadband Internet, by Zip Code (ZCTA5) — Alaska
- % of Households with Broadband Internet, by Zip Code (ZCTA5) — Utah
- % of Households with Broadband Internet, by Zip Code (ZCTA5) — Idaho
- % of Households with Broadband Internet, by Zip Code (ZCTA5) — Alabama
- % of Households with Broadband Internet, by Zip Code (ZCTA5) — Montana
- % of Households with Broadband Internet, by Zip Code (ZCTA5) — Texas