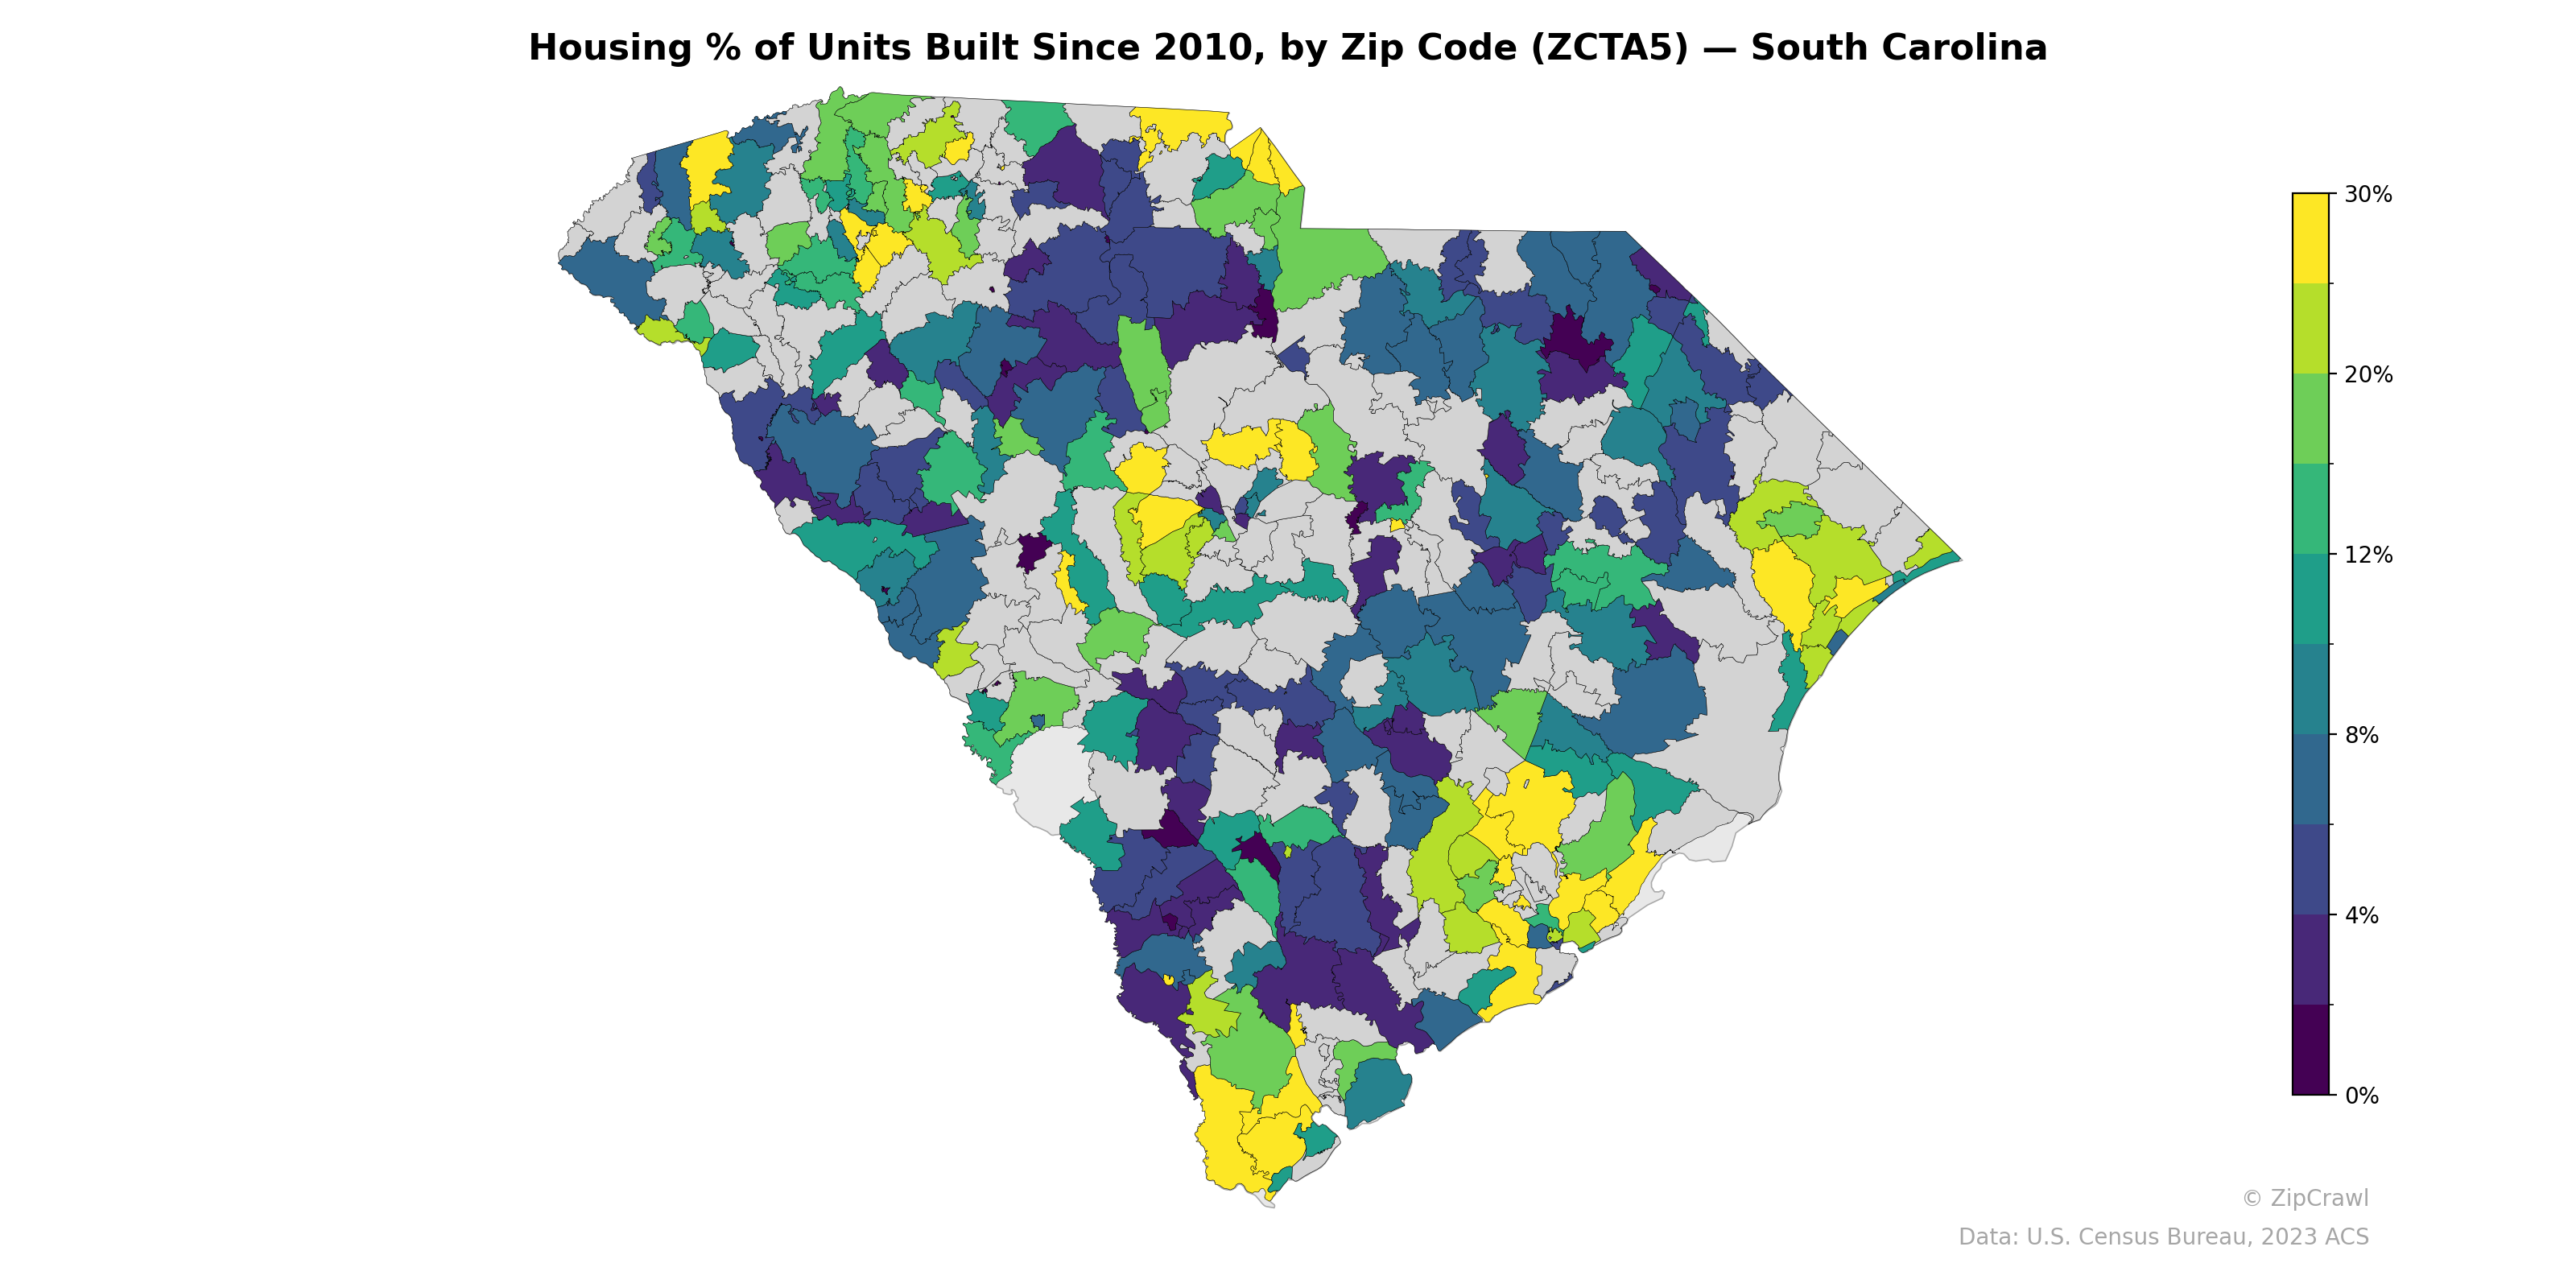
NOTE: Gray indicates insufficient data or a suppressed estimate.
The highest concentrations of post-2010 housing construction cluster in the upstate region near Greenville-Spartanburg, the suburban fringes around Columbia, and portions of the coastal Lowcountry near Charleston, Myrtle Beach, and Hilton Head—areas driven by sustained population growth and economic expansion. In contrast, large swaths of the rural Pee Dee region, parts of the Midlands, and several inland zip codes display notably low percentages (under 4%), reflecting stagnant or declining housing demand. The sharp contrasts between adjacent zip codes, particularly around metro edges, highlight the uneven and sprawl-driven nature of South Carolina's recent residential development.
Data: U.S. Census Bureau, 2023 ACS
Explore
- Housing Owner-Occupied Median Value ($), by Zip Code (ZCTA5) — Texas
- Bachelor's Degree or Higher (% of Over 25) by Zip Code (ZCTA5) — South Carolina
- % of Population without Health Insurance, by Zip Code (ZCTA5) — South Carolina
- High School Graduate (% of Over 25) by Zip Code (ZCTA5) — South Carolina
- Housing Owner-Occupied % of Units, by Zip Code (ZCTA5) — South Carolina
- Housing Owner-Occupied Median Value ($), by Zip Code (ZCTA5) — South Carolina
- % of Households with Broadband Internet, by Zip Code (ZCTA5) — South Carolina
- Population Non-Hispanic American Indian % by Zip Code (ZCTA5) — South Carolina
- Household Average Size by Zip Code (ZCTA5) — South Carolina
- Housing Median Monthly Rent ($), by Zip Code (ZCTA5) — South Carolina
- Bachelor's Degree or Higher (% of Over 25) by County
- Household Average Size by Zip Code (ZCTA5) — Texas
- Housing Vacancy Rate by Zip Code (ZCTA5) — Texas
- Housing Owner-Occupied % of Units, by Zip Code (ZCTA5) — Texas
- Bachelor's Degree or Higher (% of Over 25) by Zip Code (ZCTA5) — Texas
- Housing Median Monthly Rent ($), by Zip Code (ZCTA5) — Texas
- % of Households with Broadband Internet, by Zip Code (ZCTA5) — Texas
- % of Population without Health Insurance, by Zip Code (ZCTA5) — Texas
- Population Non-Hispanic American Indian % by Zip Code (ZCTA5) — Los Angeles Metro
- Married Couple (% of all Households) by Zip Code (ZCTA5) — Texas
- % of Population on Food Stamps or SNAP (Last 12 Months), by Zip Code (ZCTA5) — Wisconsin
- High School Graduate (% of Over 25) by Zip Code (ZCTA5) — Wisconsin
- U.S. Citizens (% of Population Over 18) by Zip Code (ZCTA5) — Colorado
- Population Non-Hispanic American Indian % by Zip Code (ZCTA5) — Wisconsin
- Population Non-Hispanic Black % by Zip Code (ZCTA5) — Wisconsin
- Population Non-Hispanic White % by Zip Code (ZCTA5) — Wisconsin
- Household Median Income by Zip Code (ZCTA5) — Colorado
- Bachelor's Degree or Higher (% of Over 25) by Zip Code (ZCTA5) — Wisconsin
- Married Couple (% of all Households) by Zip Code (ZCTA5) — Wisconsin
- Median Age by Zip Code (ZCTA5) — Wisconsin
- Housing % of Units Built Since 2010, by Zip Code (ZCTA5) — North Carolina
- Housing % of Units Built Since 2010, by Zip Code (ZCTA5) — South Dakota
- Housing % of Units Built Since 2010, by Zip Code (ZCTA5) — Ohio
- Housing % of Units Built Since 2010, by Zip Code (ZCTA5) — Utah
- Housing % of Units Built Since 2010, by Zip Code (ZCTA5) — Iowa
- Housing % of Units Built Since 2010, by Zip Code (ZCTA5) — Indiana
- Housing % of Units Built Since 2010, by Zip Code (ZCTA5) — Arizona
- Housing % of Units Built Since 2010, by Zip Code (ZCTA5) — Montana
- Housing % of Units Built Since 2010, by Zip Code (ZCTA5) — Idaho
- Housing % of Units Built Since 2010, by Zip Code (ZCTA5) — Texas