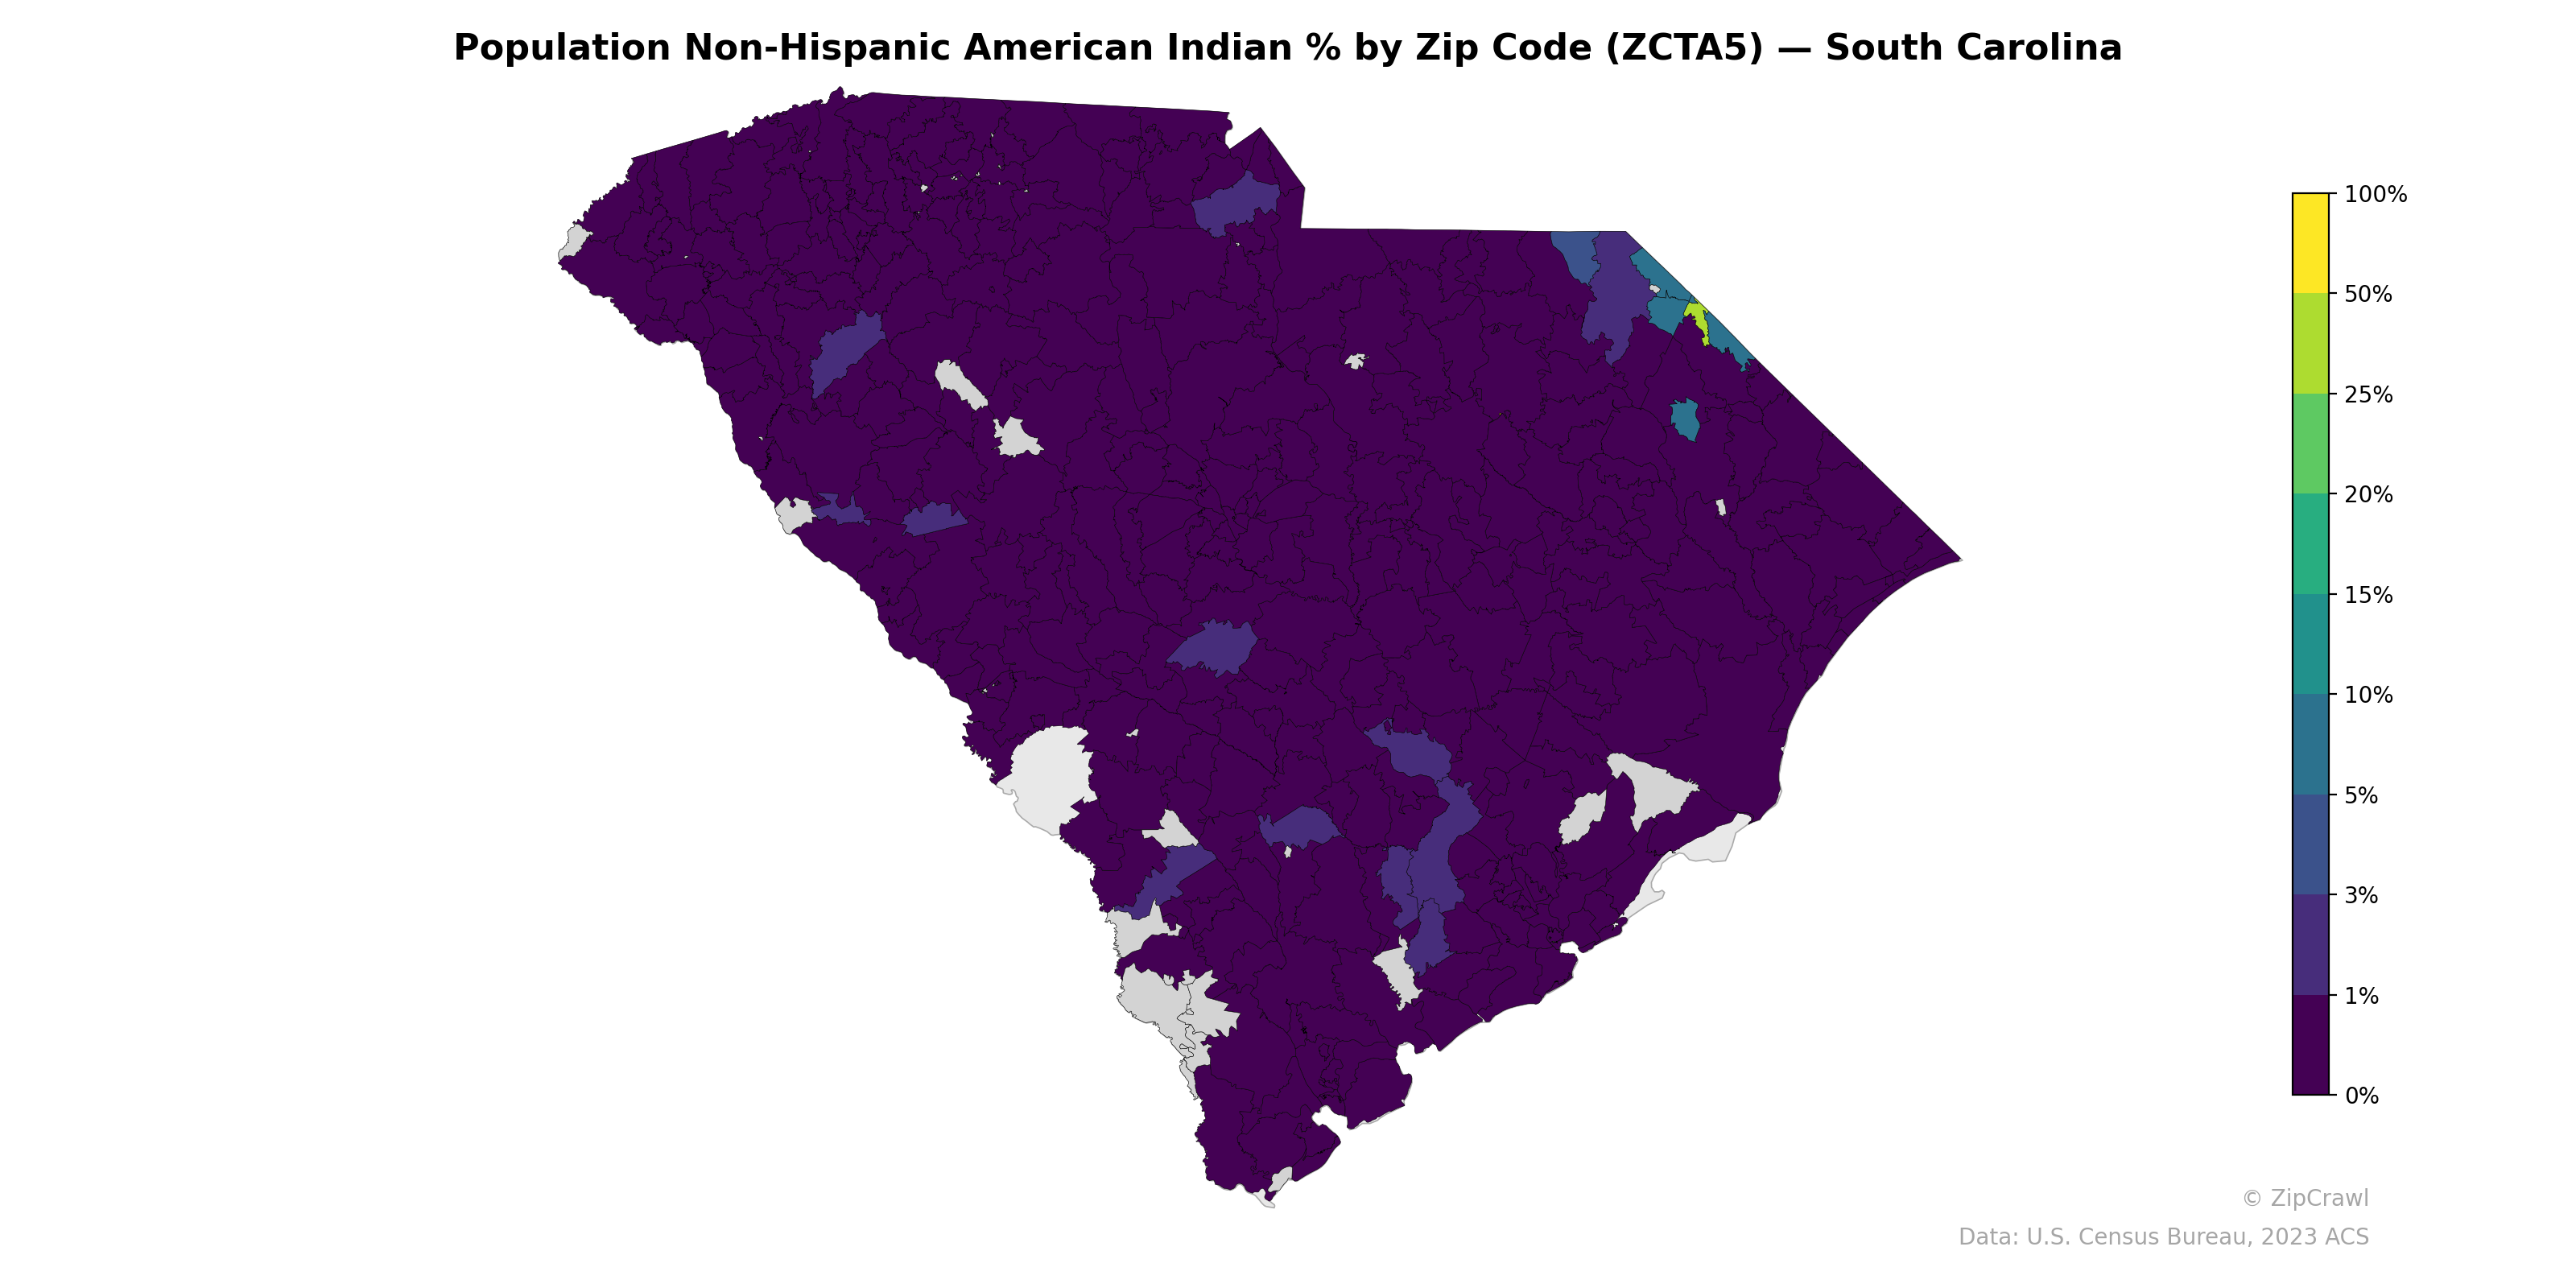
NOTE: Gray indicates insufficient data or a suppressed estimate.
The vast majority of South Carolina zip codes have Non-Hispanic American Indian populations below 1%, with the state displaying a predominantly uniform dark purple shading across most regions. A notable exception appears in the northeastern coastal area near the North Carolina border—likely in the Dillon and Marlboro county region—where one zip code reaches approximately 50% or higher, likely reflecting the presence of the Lumbee or Pee Dee tribal communities. Scattered zip codes with slightly elevated percentages (1–3%) appear in the Midlands, Lowcountry, and a few upstate areas, though these remain isolated rather than forming any broader regional cluster.
Data: U.S. Census Bureau, 2023 ACS
Explore
- Housing Owner-Occupied Median Value ($), by Zip Code (ZCTA5) — Texas
- High School Graduate (% of Over 25) by Zip Code (ZCTA5) — South Carolina
- Housing Owner-Occupied % of Units, by Zip Code (ZCTA5) — South Carolina
- Housing Owner-Occupied Median Value ($), by Zip Code (ZCTA5) — South Carolina
- % of Population without Health Insurance, by Zip Code (ZCTA5) — South Carolina
- Housing Median Monthly Rent ($), by Zip Code (ZCTA5) — South Carolina
- Bachelor's Degree or Higher (% of Over 25) by Zip Code (ZCTA5) — South Carolina
- % of Households with Broadband Internet, by Zip Code (ZCTA5) — South Carolina
- Housing % of Units Built Since 2010, by Zip Code (ZCTA5) — South Carolina
- Household Average Size by Zip Code (ZCTA5) — South Carolina
- Bachelor's Degree or Higher (% of Over 25) by County
- Housing Owner-Occupied % of Units, by Zip Code (ZCTA5) — Texas
- % of Population without Health Insurance, by Zip Code (ZCTA5) — Texas
- Married Couple (% of all Households) by Zip Code (ZCTA5) — Texas
- Bachelor's Degree or Higher (% of Over 25) by Zip Code (ZCTA5) — Texas
- Household Average Size by Zip Code (ZCTA5) — Texas
- Housing % of Units Built Since 2010, by Zip Code (ZCTA5) — Texas
- Housing Median Monthly Rent ($), by Zip Code (ZCTA5) — Texas
- % of Households with Broadband Internet, by Zip Code (ZCTA5) — Texas
- % of Population on Food Stamps or SNAP (Last 12 Months), by Zip Code (ZCTA5) — New York Metro
- Housing Vacancy Rate by Zip Code (ZCTA5) — Texas
- Bachelor's Degree or Higher (% of Over 25) by Zip Code (ZCTA5) — Wisconsin
- % of Population on Food Stamps or SNAP (Last 12 Months), by Zip Code (ZCTA5) — Wisconsin
- High School Graduate (% of Over 25) by Zip Code (ZCTA5) — Wisconsin
- Population Non-Hispanic Black % by Zip Code (ZCTA5) — Wisconsin
- Population Non-Hispanic White % by Zip Code (ZCTA5) — Wisconsin
- U.S. Citizens (% of Population Over 18) by Zip Code (ZCTA5) — Colorado
- Household Average Size by Zip Code (ZCTA5) — Wisconsin
- Median Age by Zip Code (ZCTA5) — Wisconsin
- Married Couple (% of all Households) by Zip Code (ZCTA5) — Wisconsin
- Population Non-Hispanic American Indian % by Zip Code (ZCTA5) — North Carolina
- Population Non-Hispanic American Indian % by Zip Code (ZCTA5) — South Dakota
- Population Non-Hispanic American Indian % by Zip Code (ZCTA5) — Indiana
- Population Non-Hispanic American Indian % by Zip Code (ZCTA5) — Iowa
- Population Non-Hispanic American Indian % by Zip Code (ZCTA5) — Arizona
- Population Non-Hispanic American Indian % by Zip Code (ZCTA5) — Ohio
- Population Non-Hispanic American Indian % by Zip Code (ZCTA5) — Utah
- Population Non-Hispanic American Indian % by Zip Code (ZCTA5) — Idaho
- Population Non-Hispanic American Indian % by Zip Code (ZCTA5) — Montana
- Population Non-Hispanic American Indian % by Zip Code (ZCTA5) — Illinois