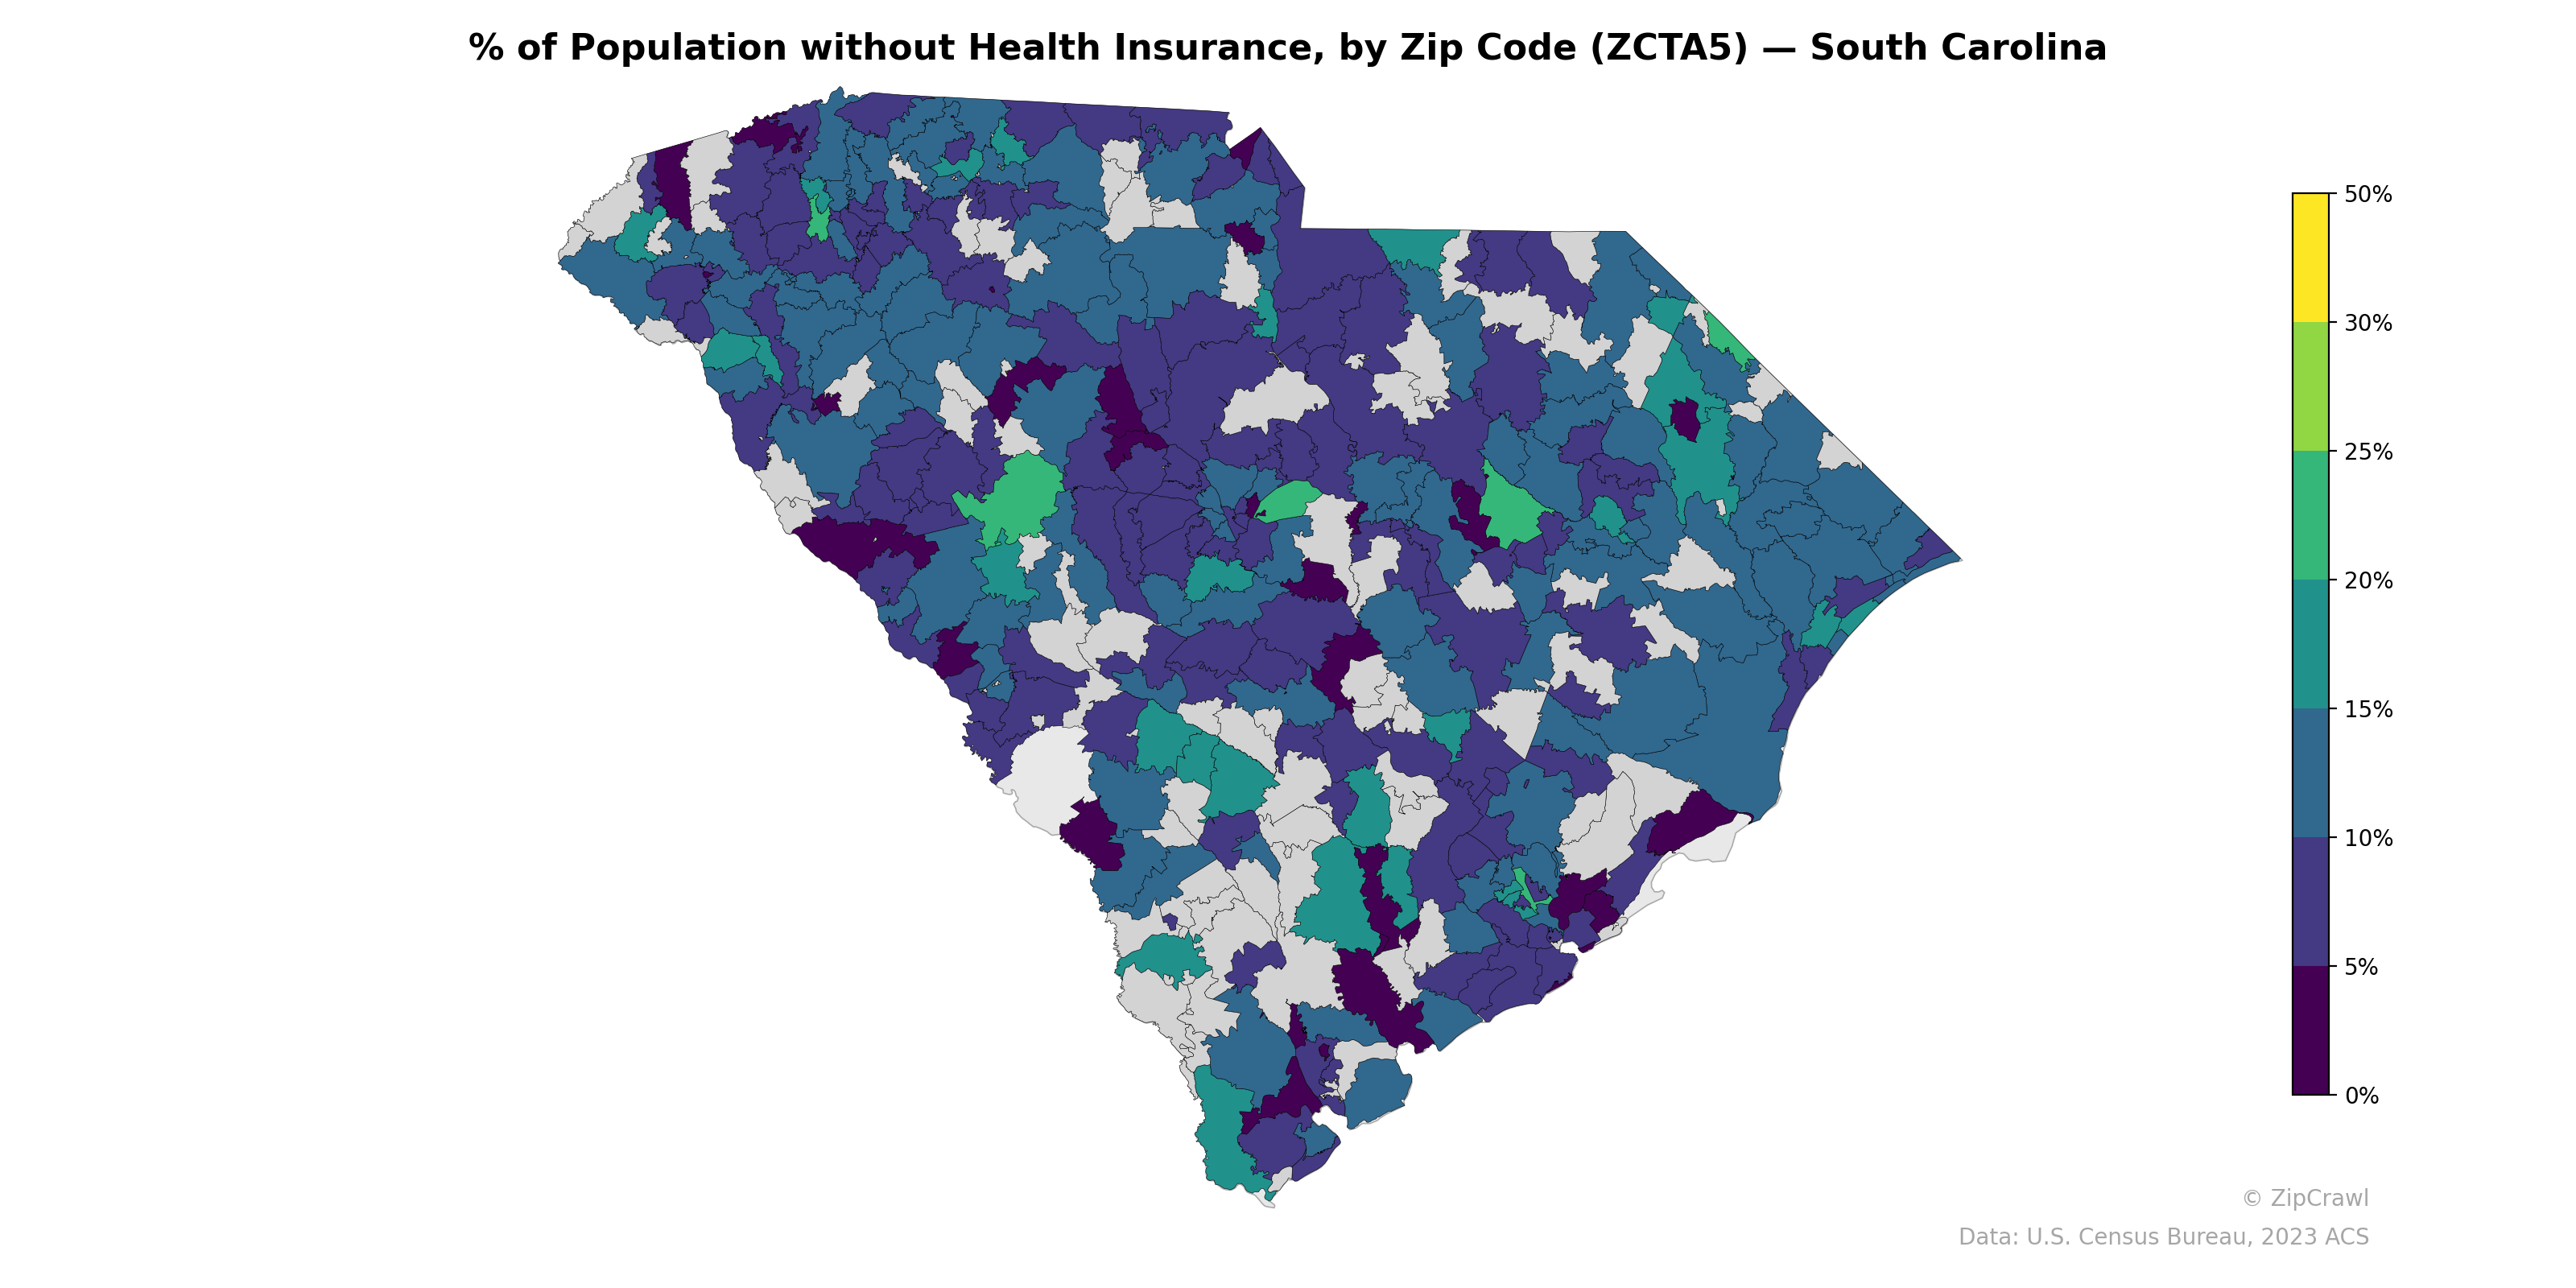
NOTE: Gray indicates insufficient data or a suppressed estimate.
Uninsured rates across South Carolina exhibit substantial geographic variation, with several zip codes in the rural Midlands and Pee Dee regions displaying rates exceeding 20–25%, while coastal and suburban areas around Charleston, Hilton Head, and the immediate Columbia metro tend toward lower uninsured percentages in the 5–10% range. A notable cluster of very low uninsured rates (under 5%) appears in scattered zip codes near military installations and affluent suburban communities, contrasting sharply with adjacent rural zip codes that can exceed 15–20%. The northwestern Upstate region shows a mixed pattern, with pockets of higher uninsured rates—likely correlated with Hispanic/Latino agricultural workforce concentrations—interspersed among zip codes with moderate coverage levels.
Data: U.S. Census Bureau, 2023 ACS
Explore
- Housing Owner-Occupied Median Value ($), by Zip Code (ZCTA5) — Texas
- Bachelor's Degree or Higher (% of Over 25) by Zip Code (ZCTA5) — South Carolina
- Housing Owner-Occupied % of Units, by Zip Code (ZCTA5) — South Carolina
- High School Graduate (% of Over 25) by Zip Code (ZCTA5) — South Carolina
- Housing Owner-Occupied Median Value ($), by Zip Code (ZCTA5) — South Carolina
- Housing Median Monthly Rent ($), by Zip Code (ZCTA5) — South Carolina
- % of Households with Broadband Internet, by Zip Code (ZCTA5) — South Carolina
- Population Non-Hispanic American Indian % by Zip Code (ZCTA5) — South Carolina
- Household Average Size by Zip Code (ZCTA5) — South Carolina
- Housing % of Units Built Since 2010, by Zip Code (ZCTA5) — South Carolina
- Bachelor's Degree or Higher (% of Over 25) by County
- Household Average Size by Zip Code (ZCTA5) — Texas
- Housing Vacancy Rate by Zip Code (ZCTA5) — Texas
- Housing % of Units Built Since 2010, by Zip Code (ZCTA5) — Texas
- Bachelor's Degree or Higher (% of Over 25) by Zip Code (ZCTA5) — Texas
- Housing Median Monthly Rent ($), by Zip Code (ZCTA5) — Texas
- % of Households with Broadband Internet, by Zip Code (ZCTA5) — Texas
- Housing Owner-Occupied % of Units, by Zip Code (ZCTA5) — Texas
- Median Age by Zip Code (ZCTA5) — Los Angeles Metro
- Married Couple (% of all Households) by Zip Code (ZCTA5) — Texas
- % of Population on Food Stamps or SNAP (Last 12 Months), by Zip Code (ZCTA5) — Wisconsin
- High School Graduate (% of Over 25) by Zip Code (ZCTA5) — Wisconsin
- U.S. Citizens (% of Population Over 18) by Zip Code (ZCTA5) — Colorado
- Population Non-Hispanic American Indian % by Zip Code (ZCTA5) — Wisconsin
- Population Non-Hispanic Black % by Zip Code (ZCTA5) — Wisconsin
- Population Non-Hispanic White % by Zip Code (ZCTA5) — Wisconsin
- Household Median Income by Zip Code (ZCTA5) — Colorado
- Bachelor's Degree or Higher (% of Over 25) by Zip Code (ZCTA5) — Wisconsin
- Married Couple (% of all Households) by Zip Code (ZCTA5) — Wisconsin
- Median Age by Zip Code (ZCTA5) — Wisconsin
- % of Population without Health Insurance, by Zip Code (ZCTA5) — North Carolina
- % of Population without Health Insurance, by Zip Code (ZCTA5) — South Dakota
- % of Population without Health Insurance, by Zip Code (ZCTA5) — Indiana
- % of Population without Health Insurance, by Zip Code (ZCTA5) — Iowa
- % of Population without Health Insurance, by Zip Code (ZCTA5) — Ohio
- % of Population without Health Insurance, by Zip Code (ZCTA5) — Oregon
- % of Population without Health Insurance, by Zip Code (ZCTA5) — Utah
- % of Population without Health Insurance, by Zip Code (ZCTA5) — Idaho
- % of Population without Health Insurance, by Zip Code (ZCTA5) — Arizona
- % of Population without Health Insurance, by Zip Code (ZCTA5) — Illinois