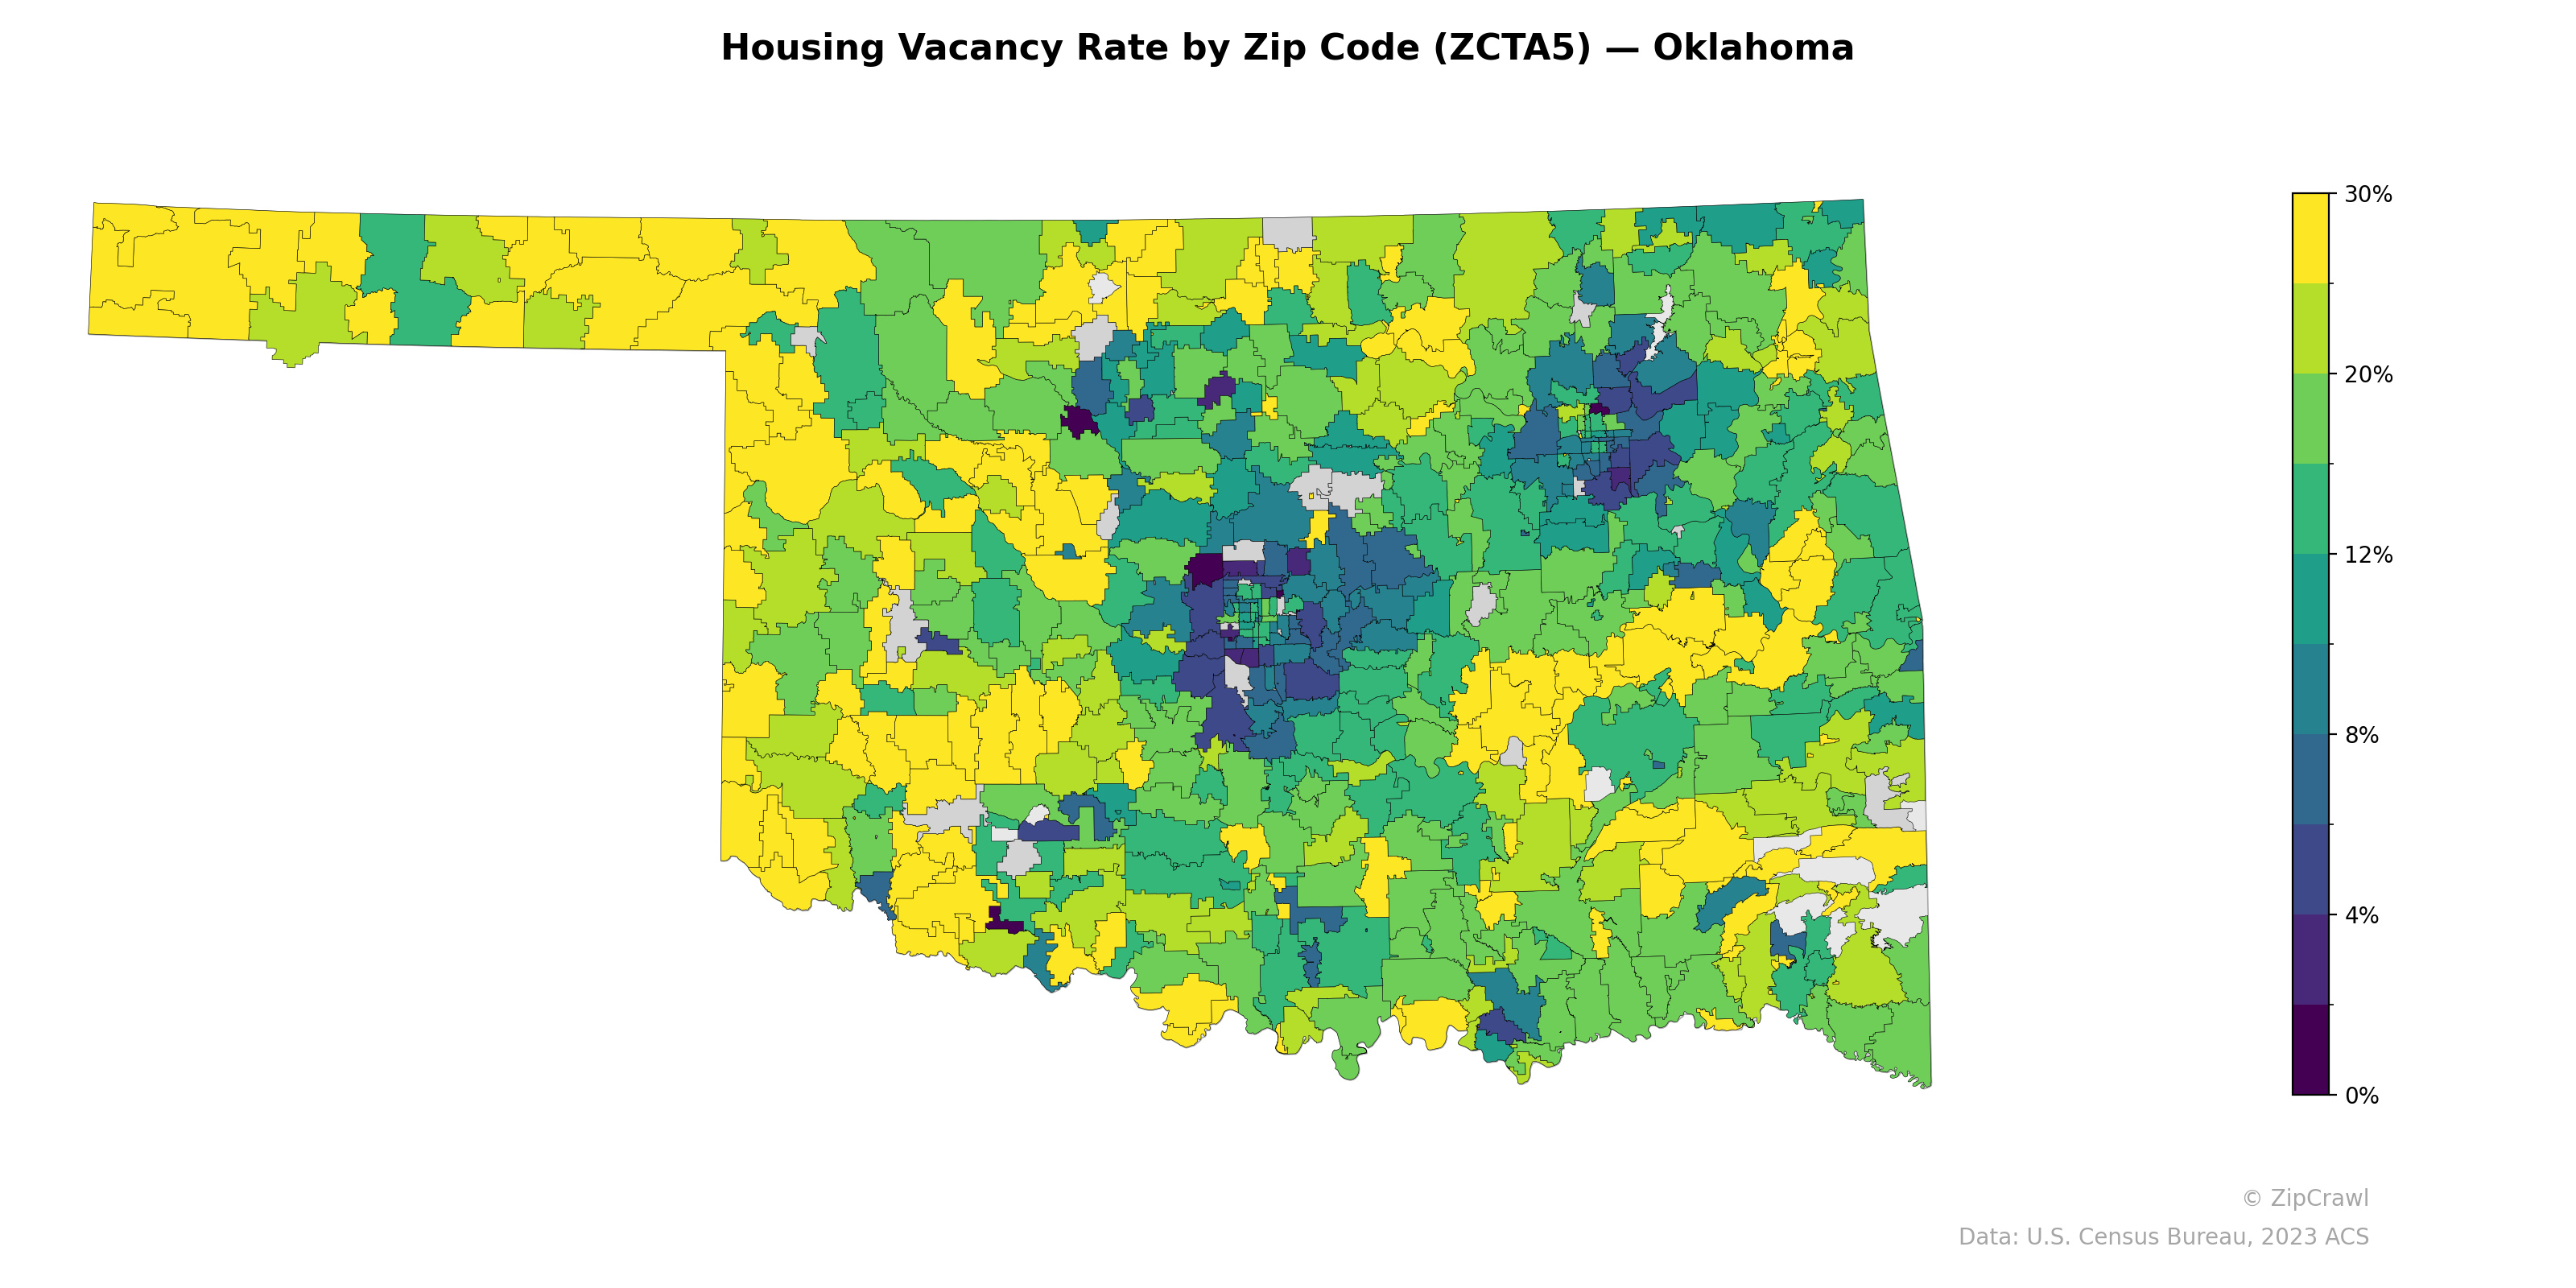
NOTE: Gray indicates insufficient data or a suppressed estimate.
The Oklahoma City and Tulsa metropolitan cores exhibit notably low vacancy rates, often below 4%, reflecting strong housing demand in the state's primary urban centers, while their surrounding suburban zip codes transition to moderate rates in the 8–12% range. Rural western Oklahoma, particularly the central-west and southwestern panhandle-adjacent regions, displays consistently elevated vacancy rates exceeding 20%, indicative of population decline and weaker housing markets in agricultural communities. A distinct east-west gradient emerges, with northeastern Oklahoma around the Tulsa metro maintaining tighter housing markets compared to the sparsely populated western half of the state.
Data: U.S. Census Bureau, 2023 ACS
Explore
- % of Households with Broadband Internet, by Zip Code (ZCTA5) — Pennsylvania
- Population Non-Hispanic Asian % by Zip Code (ZCTA5) — Oklahoma
- Household Median Income by Zip Code (ZCTA5) — Connecticut
- Population Non-Hispanic White % by Zip Code (ZCTA5) — Connecticut
- Married Couple (% of all Households) by Zip Code (ZCTA5) — Oklahoma
- Population Hispanic % by Zip Code (ZCTA5) — Connecticut
- Median Age by Zip Code (ZCTA5) — Connecticut
- U.S. Citizens (% of Population Over 18) by Zip Code (ZCTA5) — Connecticut
- Population Non-Hispanic Black % by Zip Code (ZCTA5) — Connecticut
- % of Population on Food Stamps or SNAP (Last 12 Months), by Zip Code (ZCTA5) — Oklahoma
- Housing Owner-Occupied % of Units, by County
- Housing Owner-Occupied Median Value ($), by Zip Code (ZCTA5) — California
- % of Population without Health Insurance, by Zip Code (ZCTA5) — California
- Housing % of Units Built Since 2010, by Zip Code (ZCTA5) — California
- Bachelor's Degree or Higher (% of Over 25) by Zip Code (ZCTA5) — California
- Housing Median Monthly Rent ($), by Zip Code (ZCTA5) — California
- % of Households with Broadband Internet, by Zip Code (ZCTA5) — California
- Household Average Size by Zip Code (ZCTA5) — California
- Married Couple (% of all Households) by Zip Code (ZCTA5) — California
- Housing Owner-Occupied % of Units, by Zip Code (ZCTA5) — California
- Housing % of Units Built Since 2010, by Zip Code (ZCTA5) — Oregon
- Household Average Size by Zip Code (ZCTA5) — Oregon
- Population Non-Hispanic Black % by Zip Code (ZCTA5) — Oregon
- High School Graduate (% of Over 25) by Zip Code (ZCTA5) — Oregon
- Population Non-Hispanic American Indian % by Zip Code (ZCTA5) — Oregon
- Population Hispanic % by Zip Code (ZCTA5) — Oregon
- Housing Median Monthly Rent ($), by Zip Code (ZCTA5) — Oregon
- Married Couple (% of all Households) by Zip Code (ZCTA5) — Oregon
- Household Median Income by Zip Code (ZCTA5) — Oregon
- U.S. Citizens (% of Population Over 18) by Zip Code (ZCTA5) — Oregon
- Housing Vacancy Rate by Zip Code (ZCTA5) — Ohio
- Housing Vacancy Rate by Zip Code (ZCTA5) — Idaho
- Housing Vacancy Rate by Zip Code (ZCTA5) — Oregon
- Housing Vacancy Rate by Zip Code (ZCTA5) — Utah
- Housing Vacancy Rate by Zip Code (ZCTA5) — Iowa
- Housing Vacancy Rate by Zip Code (ZCTA5) — Alabama
- Housing Vacancy Rate by Zip Code (ZCTA5) — Hawaii
- Housing Vacancy Rate by Zip Code (ZCTA5) — Maine
- Housing Vacancy Rate by Zip Code (ZCTA5) — Texas
- Housing Vacancy Rate by Zip Code (ZCTA5) — Wyoming