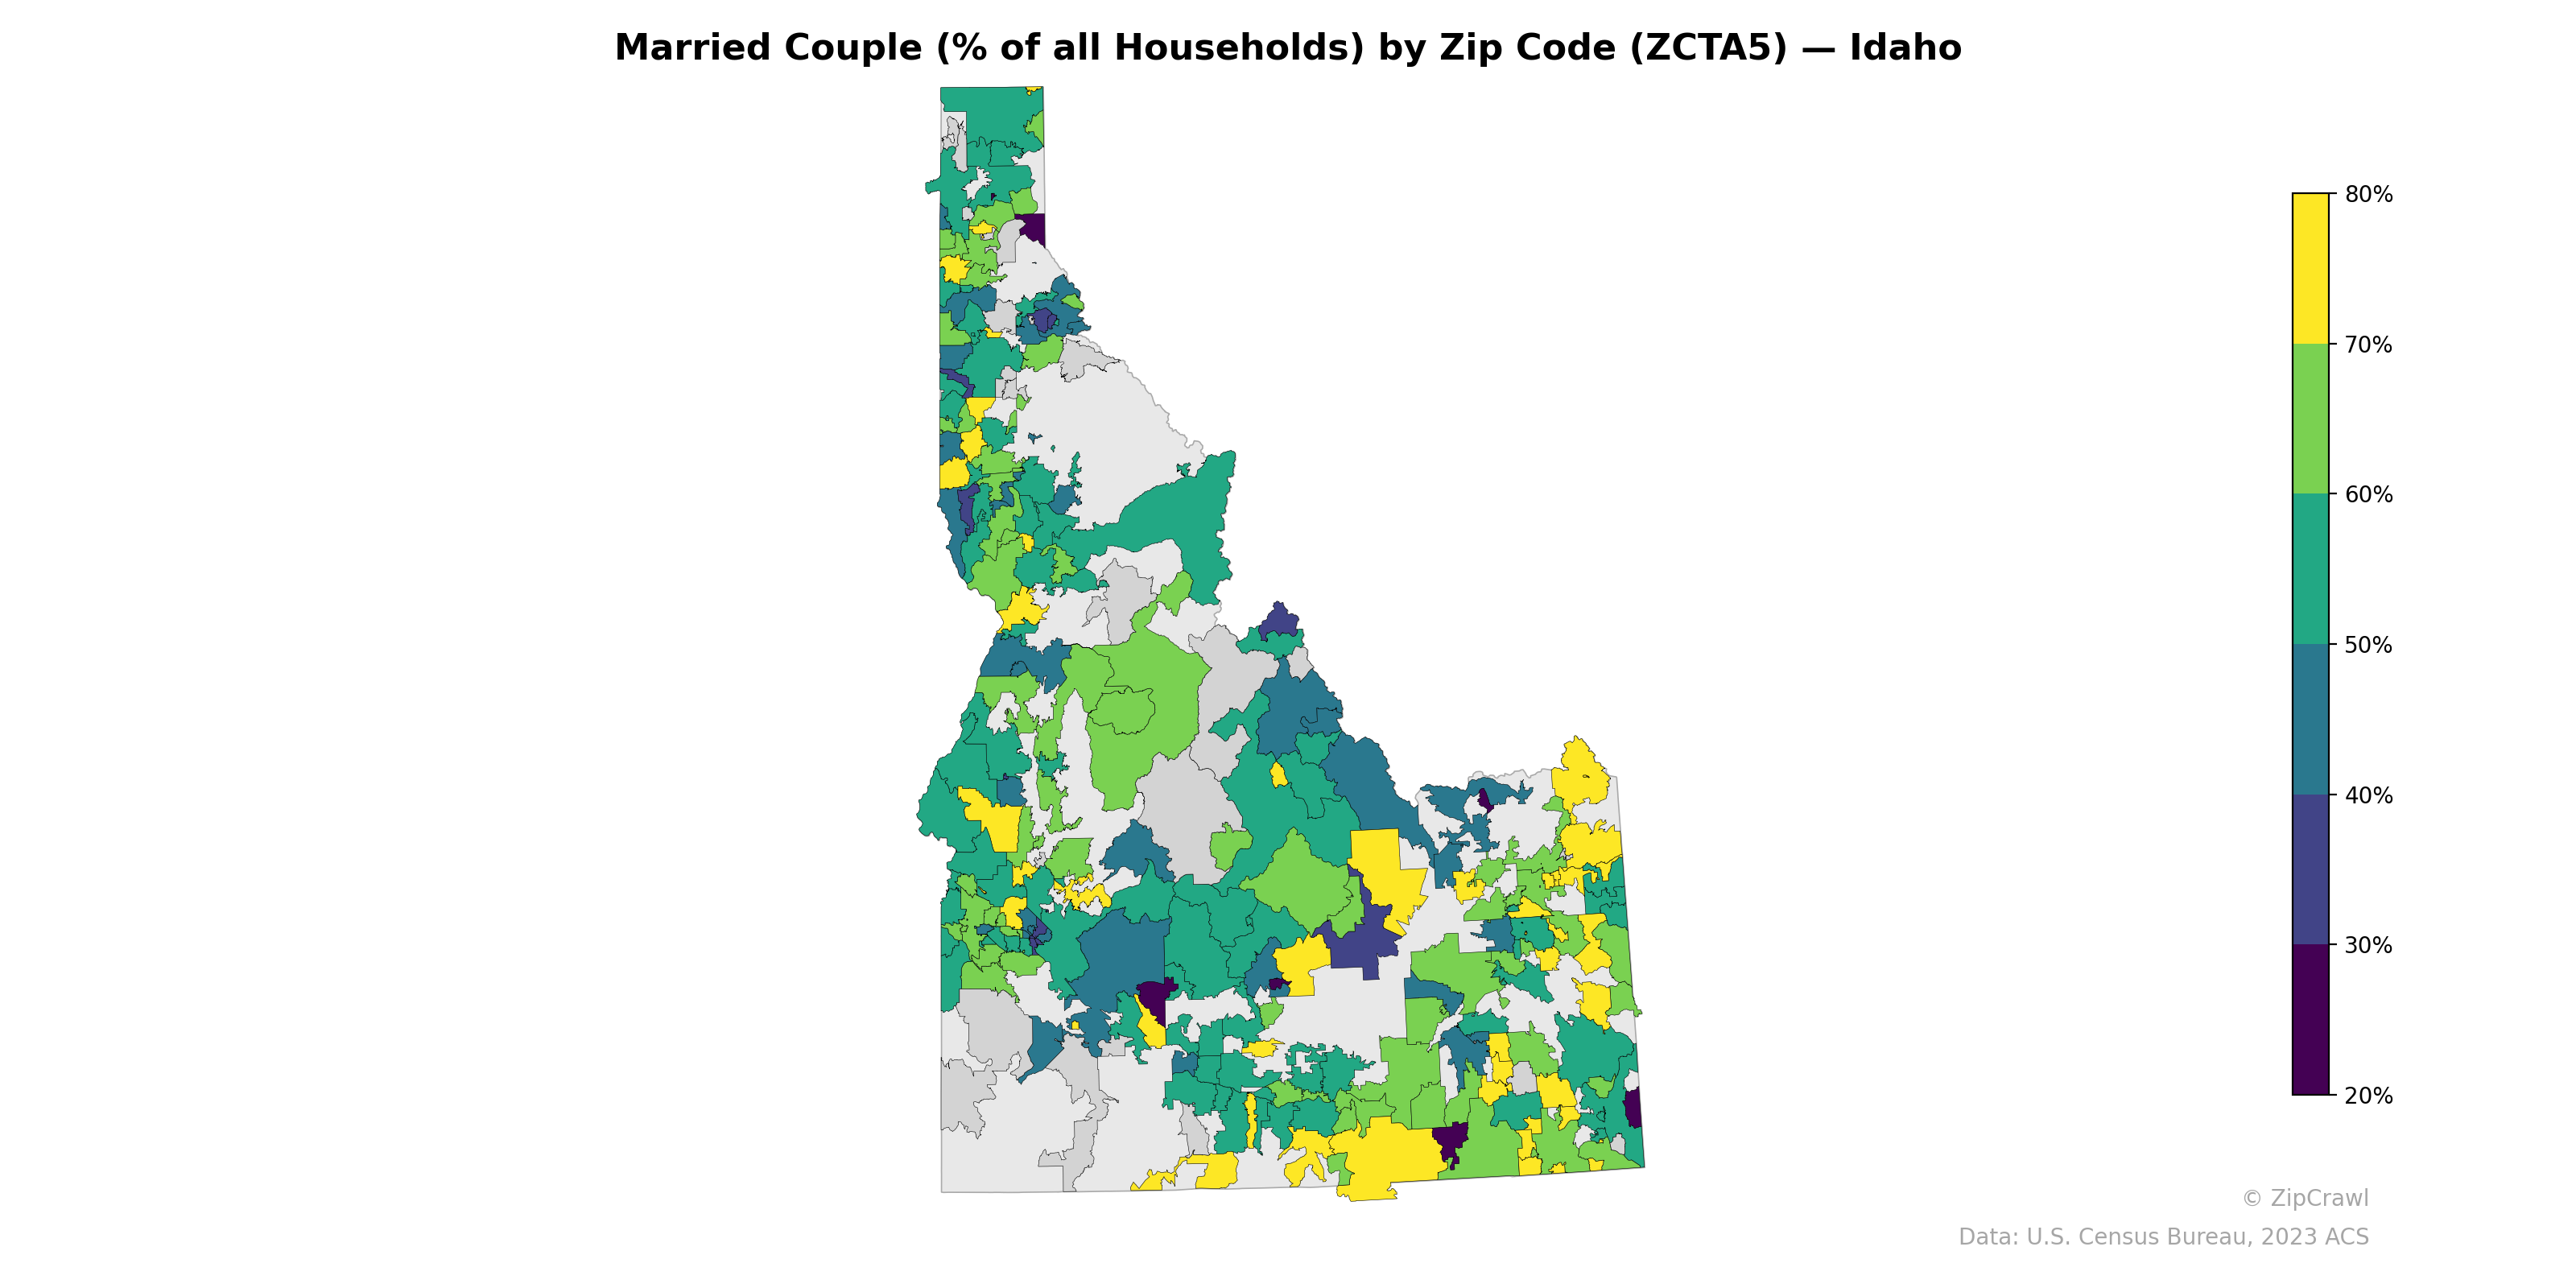
NOTE: Gray indicates insufficient data or a suppressed estimate.
Married-couple household rates in Idaho display a clear north-south gradient, with many zip codes in the rural southeastern and eastern portions of the state—particularly in the Upper Snake River Plain and Bear Lake region—reaching 70–80%, consistent with areas of higher LDS population concentration. In contrast, zip codes in and around Boise, Moscow, and several mountain resort communities in the central part of the state fall notably lower, often below 40%, reflecting younger, more transient, or college-town demographics. The panhandle region exhibits significant intra-regional variation, with deep blue pockets near Coeur d'Alene and Moscow adjacent to bright yellow exurban zip codes just a few miles away.
Data: U.S. Census Bureau, 2023 ACS
Explore
- Housing Vacancy Rate by Zip Code (ZCTA5) — Florida
- Population Hispanic % by Zip Code (ZCTA5) — West Virginia
- U.S. Citizens (% of Population Over 18) by Zip Code (ZCTA5) — West Virginia
- % of Population on Food Stamps or SNAP (Last 12 Months), by Zip Code (ZCTA5) — Idaho
- Housing Vacancy Rate by Zip Code (ZCTA5) — Idaho
- Population Non-Hispanic Black % by Zip Code (ZCTA5) — West Virginia
- Population Non-Hispanic White % by Zip Code (ZCTA5) — West Virginia
- Median Age by Zip Code (ZCTA5) — West Virginia
- Household Median Income by Zip Code (ZCTA5) — West Virginia
- Population Non-Hispanic Asian % by Zip Code (ZCTA5) — Idaho
- Housing Median Monthly Rent ($), by County
- Bachelor's Degree or Higher (% of Over 25) by Zip Code (ZCTA5) — Atlanta Metro
- Household Average Size by Zip Code (ZCTA5) — Florida
- Housing Owner-Occupied % of Units, by Zip Code (ZCTA5) — Florida
- Housing Owner-Occupied Median Value ($), by Zip Code (ZCTA5) — Florida
- Housing Median Monthly Rent ($), by Zip Code (ZCTA5) — Florida
- % of Population without Health Insurance, by Zip Code (ZCTA5) — Florida
- Bachelor's Degree or Higher (% of Over 25) by Zip Code (ZCTA5) — Pennsylvania
- Bachelor's Degree or Higher (% of Over 25) by Zip Code (ZCTA5) — Florida
- % of Households with Broadband Internet, by Zip Code (ZCTA5) — Florida
- Housing % of Units Built Since 2010, by Zip Code (ZCTA5) — Florida
- % of Population on Food Stamps or SNAP (Last 12 Months), by Zip Code (ZCTA5) — Mississippi
- % of Population without Health Insurance, by Zip Code (ZCTA5) — Mississippi
- U.S. Citizens (% of Population Over 18) by Zip Code (ZCTA5) — Kansas
- Median Age by Zip Code (ZCTA5) — Idaho
- Population Non-Hispanic American Indian % by Zip Code (ZCTA5) — Mississippi
- Bachelor's Degree or Higher (% of Over 25) by Zip Code (ZCTA5) — Mississippi
- High School Graduate (% of Over 25) by Zip Code (ZCTA5) — Mississippi
- % of Households with Broadband Internet, by Zip Code (ZCTA5) — Mississippi
- Housing Owner-Occupied % of Units, by Zip Code (ZCTA5) — Mississippi
- Married Couple (% of all Households) by Zip Code (ZCTA5) — Iowa
- Married Couple (% of all Households) by Zip Code (ZCTA5) — Maine
- Married Couple (% of all Households) by Zip Code (ZCTA5) — Ohio
- Married Couple (% of all Households) by Zip Code (ZCTA5) — Alaska
- Married Couple (% of all Households) by Zip Code (ZCTA5) — Utah
- Married Couple (% of all Households) by Zip Code (ZCTA5) — Oklahoma
- Married Couple (% of all Households) by Zip Code (ZCTA5) — Florida
- Married Couple (% of all Households) by Zip Code (ZCTA5) — Indiana
- Married Couple (% of all Households) by Zip Code (ZCTA5) — Alabama
- Married Couple (% of all Households) by Zip Code (ZCTA5) — Texas