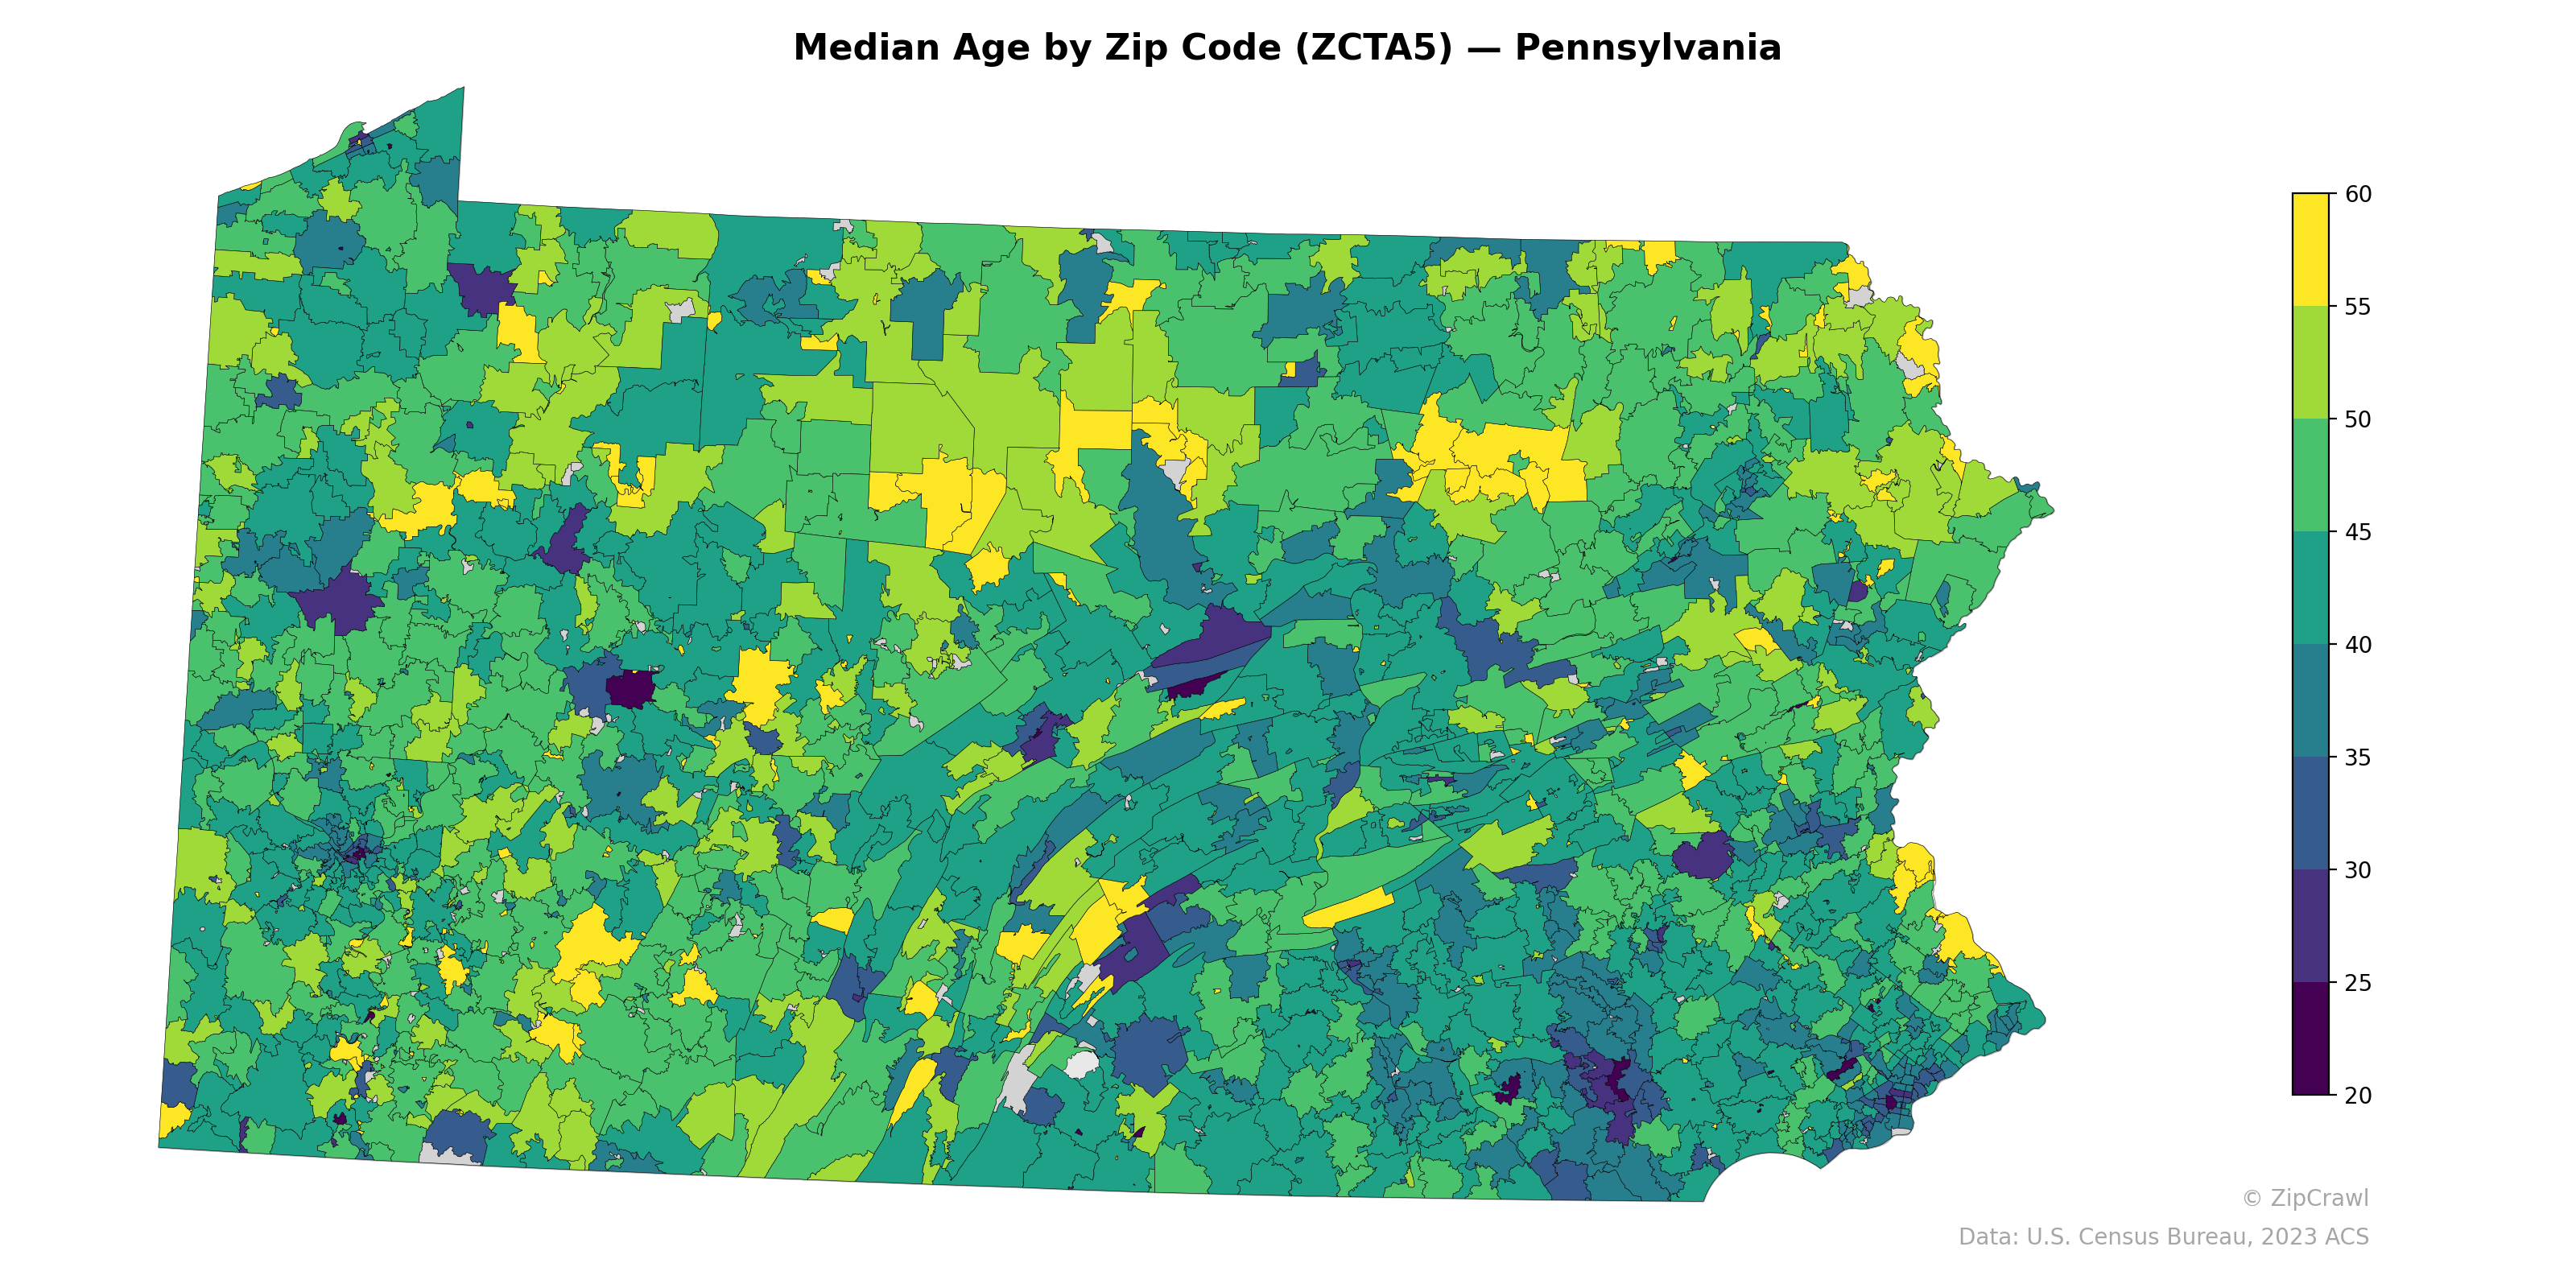
NOTE: Gray indicates insufficient data or a suppressed estimate.
The southeastern corner of Pennsylvania, encompassing the Philadelphia metropolitan area, displays stark contrasts with pockets of very low median ages (under 25, likely corresponding to university areas like University City and State College in the center of the state) adjacent to suburban zip codes with median ages well above 45. Rural northern-tier counties and areas along the Allegheny Plateau generally trend older, with median ages in the 45–55 range, while the Pittsburgh metro region in the southwest shows a mixed pattern of younger urban cores surrounded by aging suburban and exurban communities. A notable band of younger-skewing zip codes extends across the south-central part of the state, potentially reflecting younger family-oriented communities in the Lancaster, York, and Cumberland County corridors.
Data: U.S. Census Bureau, 2023 ACS
Explore
- % of Population without Health Insurance, by Zip Code (ZCTA5) — Oklahoma
- Housing % of Units Built Since 2010, by County
- Population Non-Hispanic Asian % by Zip Code (ZCTA5) — Illinois
- Population Non-Hispanic Black % by Zip Code (ZCTA5) — Pennsylvania
- Population Non-Hispanic White % by Zip Code (ZCTA5) — Pennsylvania
- Population Hispanic % by Zip Code (ZCTA5) — Pennsylvania
- U.S. Citizens (% of Population Over 18) by Zip Code (ZCTA5) — Pennsylvania
- % of Population on Food Stamps or SNAP (Last 12 Months), by Zip Code (ZCTA5) — Illinois
- High School Graduate (% of Over 25) by Zip Code (ZCTA5) — Pennsylvania
- Population Non-Hispanic American Indian % by Zip Code (ZCTA5) — Pennsylvania
- Household Median Income by Zip Code (ZCTA5) — Pennsylvania
- % of Population without Health Insurance, by Zip Code (ZCTA5) — Alaska
- % of Population without Health Insurance, by Zip Code (ZCTA5) — Arkansas
- % of Population without Health Insurance, by Zip Code (ZCTA5) — Montana
- % of Population without Health Insurance, by Zip Code (ZCTA5) — Idaho
- Household Median Income by County
- Population Non-Hispanic Asian % by County
- Married Couple (% of all Households) by County
- Household Average Size by County
- U.S. Citizens by County (% of Population Over 18)
- Housing Median Monthly Rent ($), by County
- Housing Owner-Occupied Median Value ($), by County
- % of Households with Broadband Internet, by County
- Housing Owner-Occupied % of Units, by County
- Housing Vacancy Rate by County
- Housing Owner-Occupied Median Value ($), by Zip Code (ZCTA5) — California
- % of Population without Health Insurance, by Zip Code (ZCTA5) — California
- Housing Owner-Occupied % of Units, by Zip Code (ZCTA5) — California
- Housing % of Units Built Since 2010, by Zip Code (ZCTA5) — California
- High School Graduate (% of Over 25) by Zip Code (ZCTA5) — California
- Median Age by Zip Code (ZCTA5) — Virginia
- Median Age by Zip Code (ZCTA5) — California
- Median Age by Zip Code (ZCTA5) — Iowa
- Median Age by Zip Code (ZCTA5) — Ohio
- Median Age by Zip Code (ZCTA5) — Utah
- Median Age by Zip Code (ZCTA5) — Maine
- Median Age by Zip Code (ZCTA5) — Georgia
- Median Age by Zip Code (ZCTA5) — Texas
- Median Age by Zip Code (ZCTA5) — Idaho
- Median Age by Zip Code (ZCTA5) — Indiana