NOTE: Gray indicates insufficient data or a suppressed estimate.
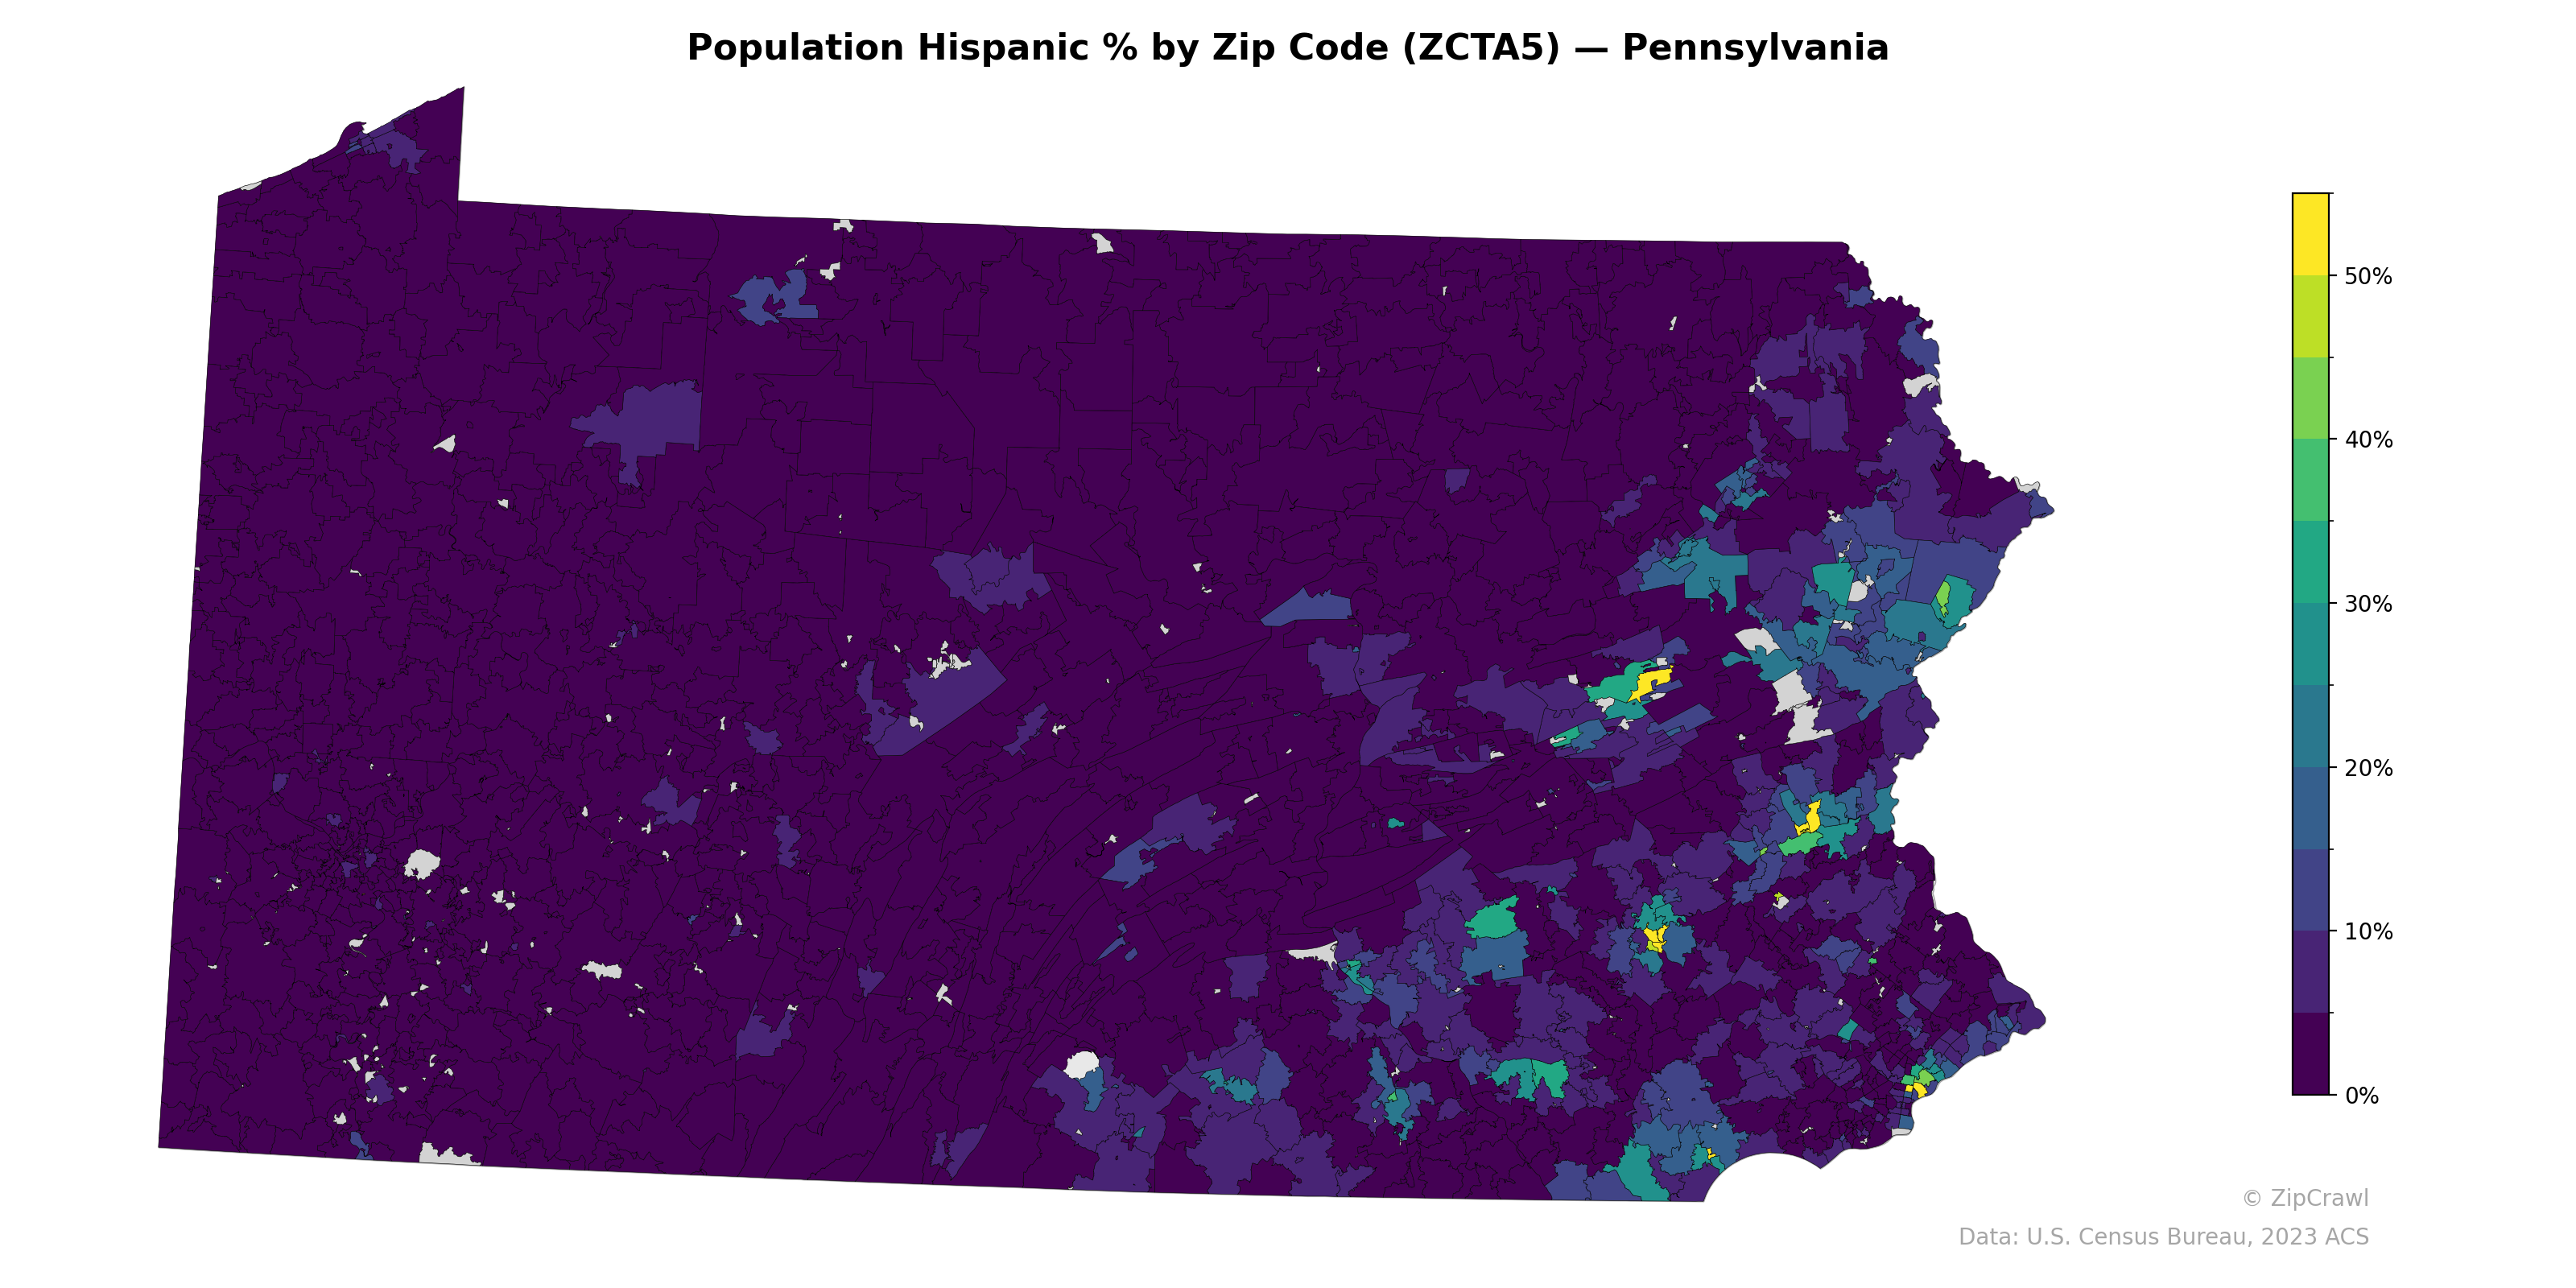
Hispanic population concentrations in Pennsylvania are heavily skewed toward the eastern portion of the state, with the highest percentages (exceeding 50%) clustered in small zip codes corresponding to cities like Reading, Allentown, Bethlehem, and Hazleton in the Lehigh Valley and surrounding region. Philadelphia and its immediate suburbs also display elevated Hispanic shares in the 20–40% range, creating a broad corridor of higher concentration across southeastern Pennsylvania. The vast majority of central and western Pennsylvania zip codes register below 5% Hispanic population, presenting a stark east-west demographic divide with only isolated pockets of moderate concentration around cities like Lancaster and York.
Data: U.S. Census Bureau, 2023 ACS
Explore
- Housing Owner-Occupied Median Value ($), by Zip Code (ZCTA5) — Oklahoma
- Housing % of Units Built Since 2010, by County
- Population Non-Hispanic Asian % by Zip Code (ZCTA5) — Illinois
- Population Non-Hispanic Black % by Zip Code (ZCTA5) — Pennsylvania
- Median Age by Zip Code (ZCTA5) — Pennsylvania
- Population Non-Hispanic White % by Zip Code (ZCTA5) — Pennsylvania
- U.S. Citizens (% of Population Over 18) by Zip Code (ZCTA5) — Pennsylvania
- Household Median Income by Zip Code (ZCTA5) — Pennsylvania
- High School Graduate (% of Over 25) by Zip Code (ZCTA5) — Pennsylvania
- Population Non-Hispanic American Indian % by Zip Code (ZCTA5) — Pennsylvania
- % of Population on Food Stamps or SNAP (Last 12 Months), by Zip Code (ZCTA5) — Illinois
- Housing Owner-Occupied Median Value ($), by Zip Code (ZCTA5) — Alaska
- Housing Owner-Occupied Median Value ($), by Zip Code (ZCTA5) — Arkansas
- Housing Owner-Occupied Median Value ($), by Zip Code (ZCTA5) — Montana
- Housing Owner-Occupied Median Value ($), by Zip Code (ZCTA5) — Idaho
- Household Median Income by County
- Married Couple (% of all Households) by County
- Household Average Size by County
- U.S. Citizens by County (% of Population Over 18)
- Housing Median Monthly Rent ($), by County
- Housing Owner-Occupied Median Value ($), by County
- Housing Owner-Occupied % of Units, by County
- % of Households with Broadband Internet, by County
- Housing Vacancy Rate by County
- Population Non-Hispanic Asian % by County
- Housing Owner-Occupied Median Value ($), by Zip Code (ZCTA5) — California
- % of Population without Health Insurance, by Zip Code (ZCTA5) — California
- Housing Owner-Occupied % of Units, by Zip Code (ZCTA5) — California
- Housing % of Units Built Since 2010, by Zip Code (ZCTA5) — California
- High School Graduate (% of Over 25) by Zip Code (ZCTA5) — California
- Population Hispanic % by Zip Code (ZCTA5) — Virginia
- Population Hispanic % by Zip Code (ZCTA5) — Ohio
- Population Hispanic % by Zip Code (ZCTA5) — Iowa
- Population Hispanic % by Zip Code (ZCTA5) — Utah
- Population Hispanic % by Zip Code (ZCTA5) — California
- Population Hispanic % by Zip Code (ZCTA5) — Georgia
- Population Hispanic % by Zip Code (ZCTA5) — Texas
- Population Hispanic % by Zip Code (ZCTA5) — Oregon
- Population Hispanic % by Zip Code (ZCTA5) — Hawaii
- Population Hispanic % by Zip Code (ZCTA5) — Idaho