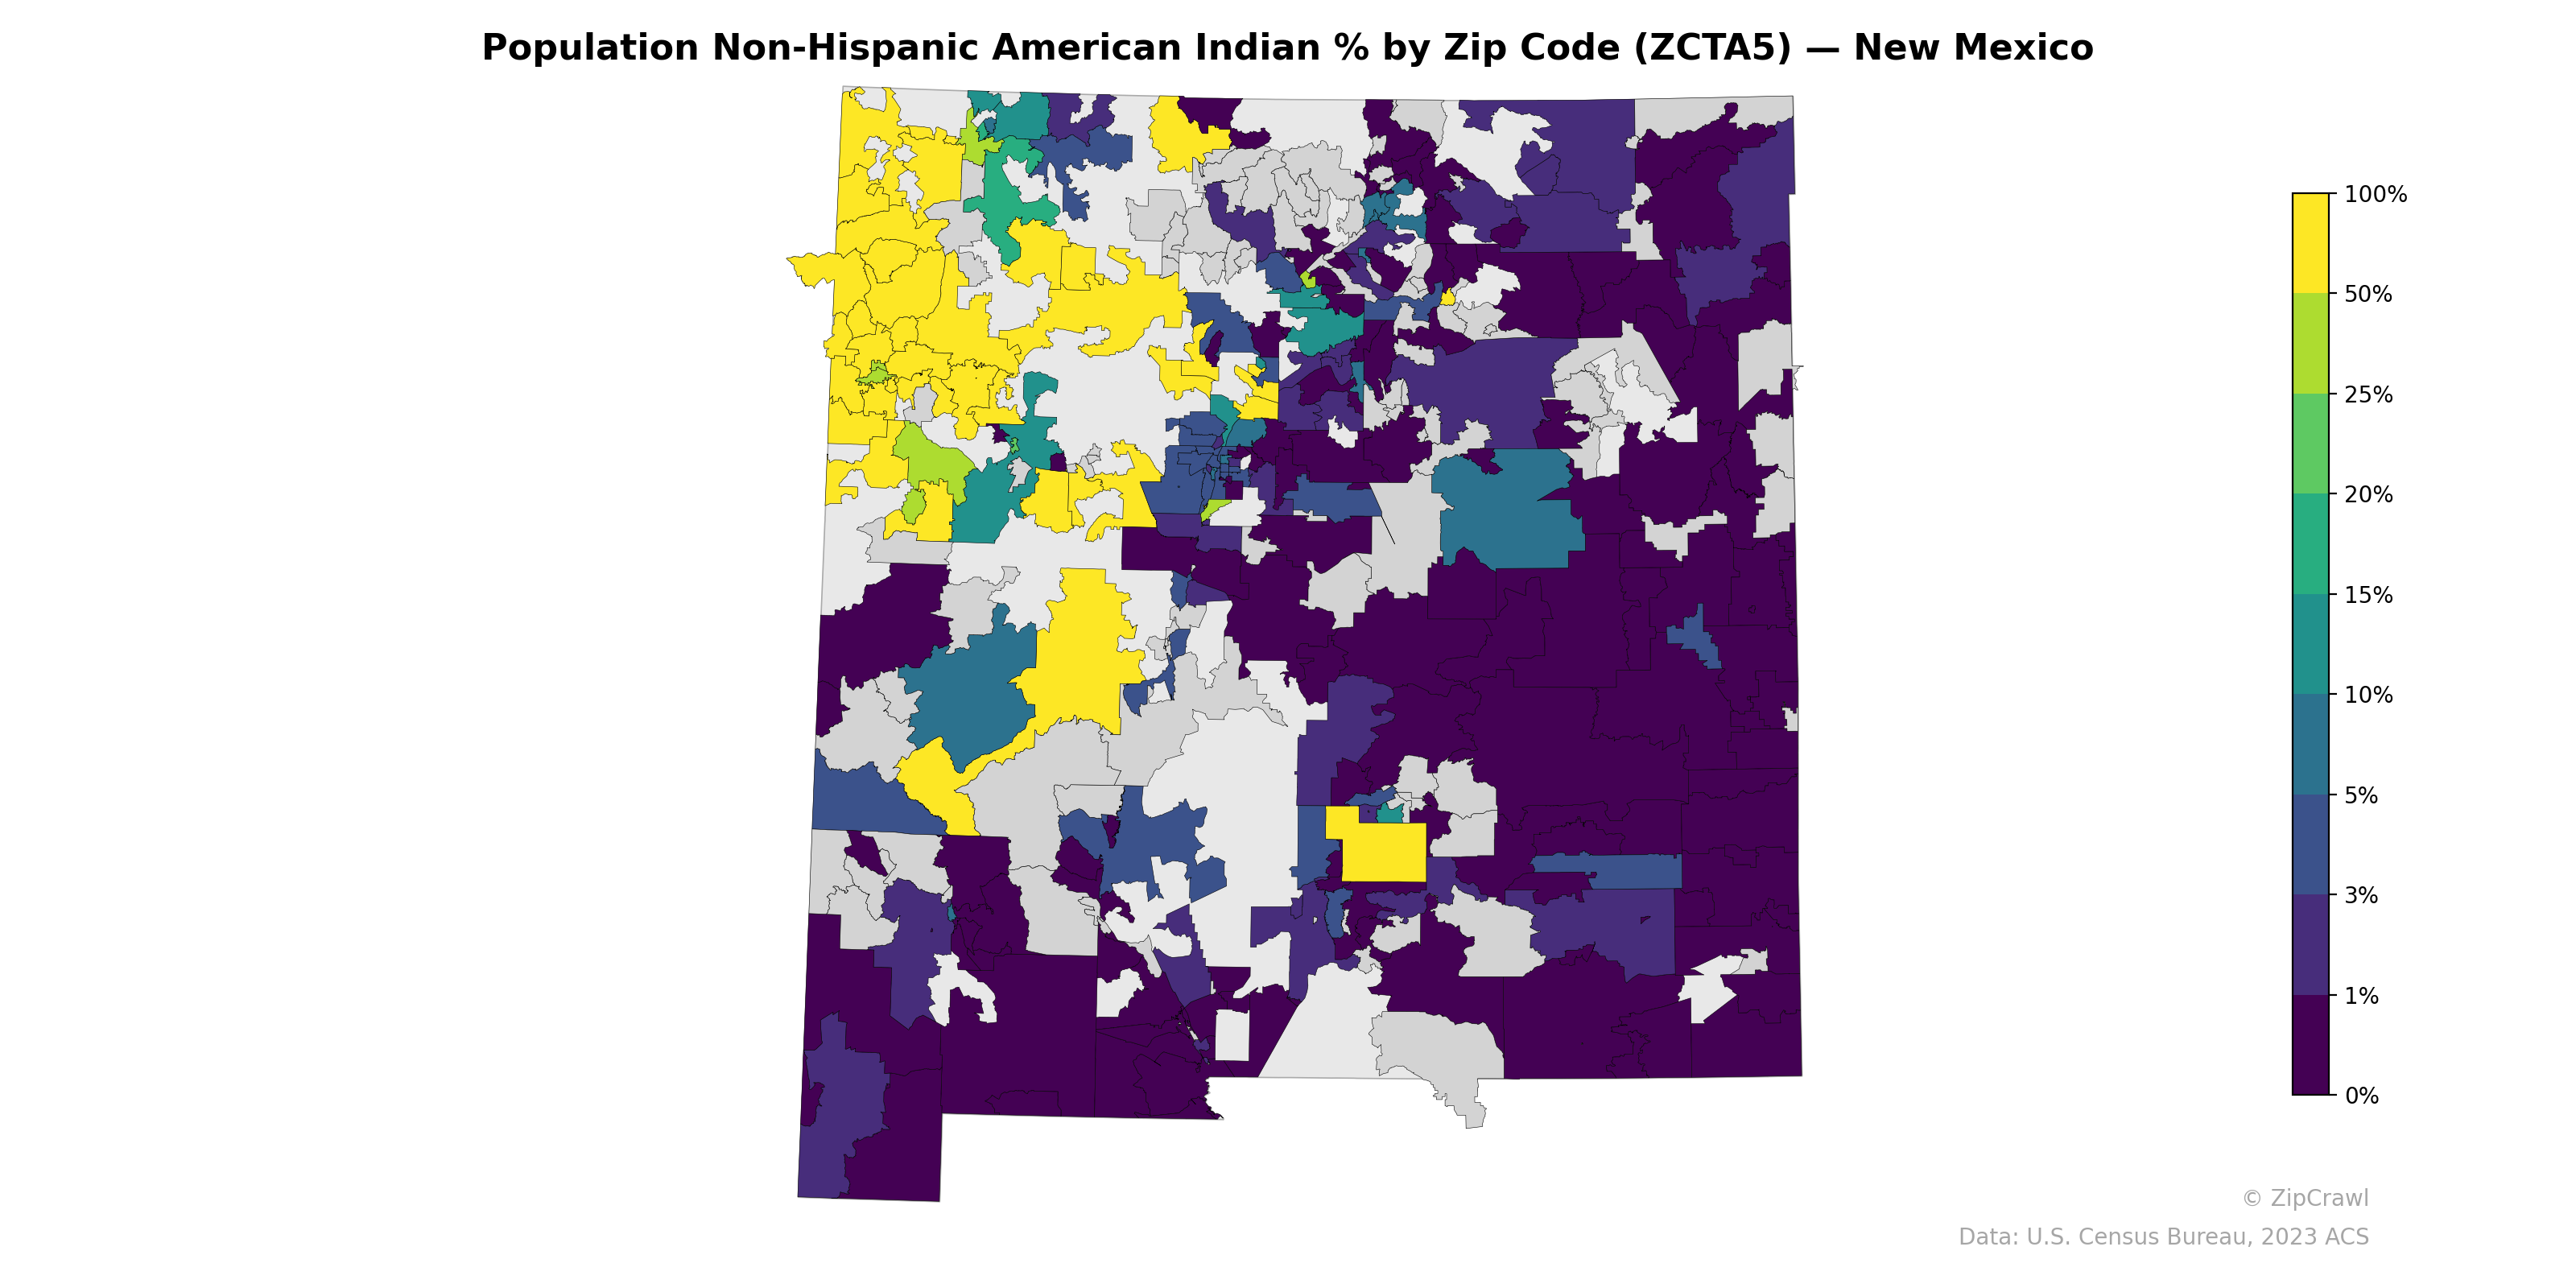
NOTE: Gray indicates insufficient data or a suppressed estimate.
The highest concentrations of Non-Hispanic American Indian population, exceeding 50% and reaching near 100%, are heavily clustered in the northwestern quadrant of New Mexico, corresponding to the Navajo Nation and surrounding tribal lands, with additional elevated pockets in north-central areas likely aligned with Pueblo communities along the Rio Grande corridor. The southeastern and south-central portions of the state consistently register near 0–1%, reflecting minimal Native American population presence across the largely non-tribal plains and basin regions. A notable contrast exists in the central part of the state around the Albuquerque metro area, where zip codes transition sharply from moderate (5–20%) to very low percentages over short distances, illustrating the abrupt demographic boundary between urban and tribal-adjacent areas.
Data: U.S. Census Bureau, 2023 ACS
Explore
- Housing Owner-Occupied Median Value ($), by Zip Code (ZCTA5) — Florida
- Household Average Size by Zip Code (ZCTA5) — New Mexico
- Housing Median Monthly Rent ($), by Zip Code (ZCTA5) — New Mexico
- Housing Owner-Occupied Median Value ($), by Zip Code (ZCTA5) — New Mexico
- High School Graduate (% of Over 25) by Zip Code (ZCTA5) — New Mexico
- Housing % of Units Built Since 2010, by Zip Code (ZCTA5) — New Mexico
- Housing Owner-Occupied % of Units, by Zip Code (ZCTA5) — New Mexico
- % of Households with Broadband Internet, by Zip Code (ZCTA5) — New Mexico
- % of Population without Health Insurance, by Zip Code (ZCTA5) — New Mexico
- Bachelor's Degree or Higher (% of Over 25) by Zip Code (ZCTA5) — New Mexico
- Housing Median Monthly Rent ($), by County
- Married Couple (% of all Households) by Zip Code (ZCTA5) — Florida
- Housing Vacancy Rate by Zip Code (ZCTA5) — Florida
- Population Non-Hispanic Asian % by Zip Code (ZCTA5) — Florida
- Population Non-Hispanic Asian % by Zip Code (ZCTA5) — Michigan
- Housing Median Monthly Rent ($), by Zip Code (ZCTA5) — Florida
- Housing Owner-Occupied % of Units, by Zip Code (ZCTA5) — Florida
- Housing % of Units Built Since 2010, by Zip Code (ZCTA5) — Florida
- Bachelor's Degree or Higher (% of Over 25) by Zip Code (ZCTA5) — Florida
- % of Population without Health Insurance, by Zip Code (ZCTA5) — Florida
- % of Households with Broadband Internet, by Zip Code (ZCTA5) — Florida
- Household Average Size by Zip Code (ZCTA5) — Florida
- Population Non-Hispanic Asian % by Zip Code (ZCTA5) — Mississippi
- % of Households with Broadband Internet, by Zip Code (ZCTA5) — Mississippi
- % of Population on Food Stamps or SNAP (Last 12 Months), by Zip Code (ZCTA5) — Mississippi
- Median Age by Zip Code (ZCTA5) — Idaho
- High School Graduate (% of Over 25) by Zip Code (ZCTA5) — Mississippi
- % of Population without Health Insurance, by Zip Code (ZCTA5) — Mississippi
- Bachelor's Degree or Higher (% of Over 25) by Zip Code (ZCTA5) — Mississippi
- Housing Vacancy Rate by Zip Code (ZCTA5) — Mississippi
- Population Non-Hispanic American Indian % by Zip Code (ZCTA5) — New York
- Population Non-Hispanic American Indian % by Zip Code (ZCTA5) — Indiana
- Population Non-Hispanic American Indian % by Zip Code (ZCTA5) — New York Metro
- Population Non-Hispanic American Indian % by Zip Code (ZCTA5) — New Jersey
- Population Non-Hispanic American Indian % by Zip Code (ZCTA5) — Nevada
- Population Non-Hispanic American Indian % by Zip Code (ZCTA5) — Maine
- Population Non-Hispanic American Indian % by Zip Code (ZCTA5) — Iowa
- Population Non-Hispanic American Indian % by Zip Code (ZCTA5) — Ohio
- Population Non-Hispanic American Indian % by Zip Code (ZCTA5) — Utah
- Population Non-Hispanic American Indian % by Zip Code (ZCTA5) — Idaho