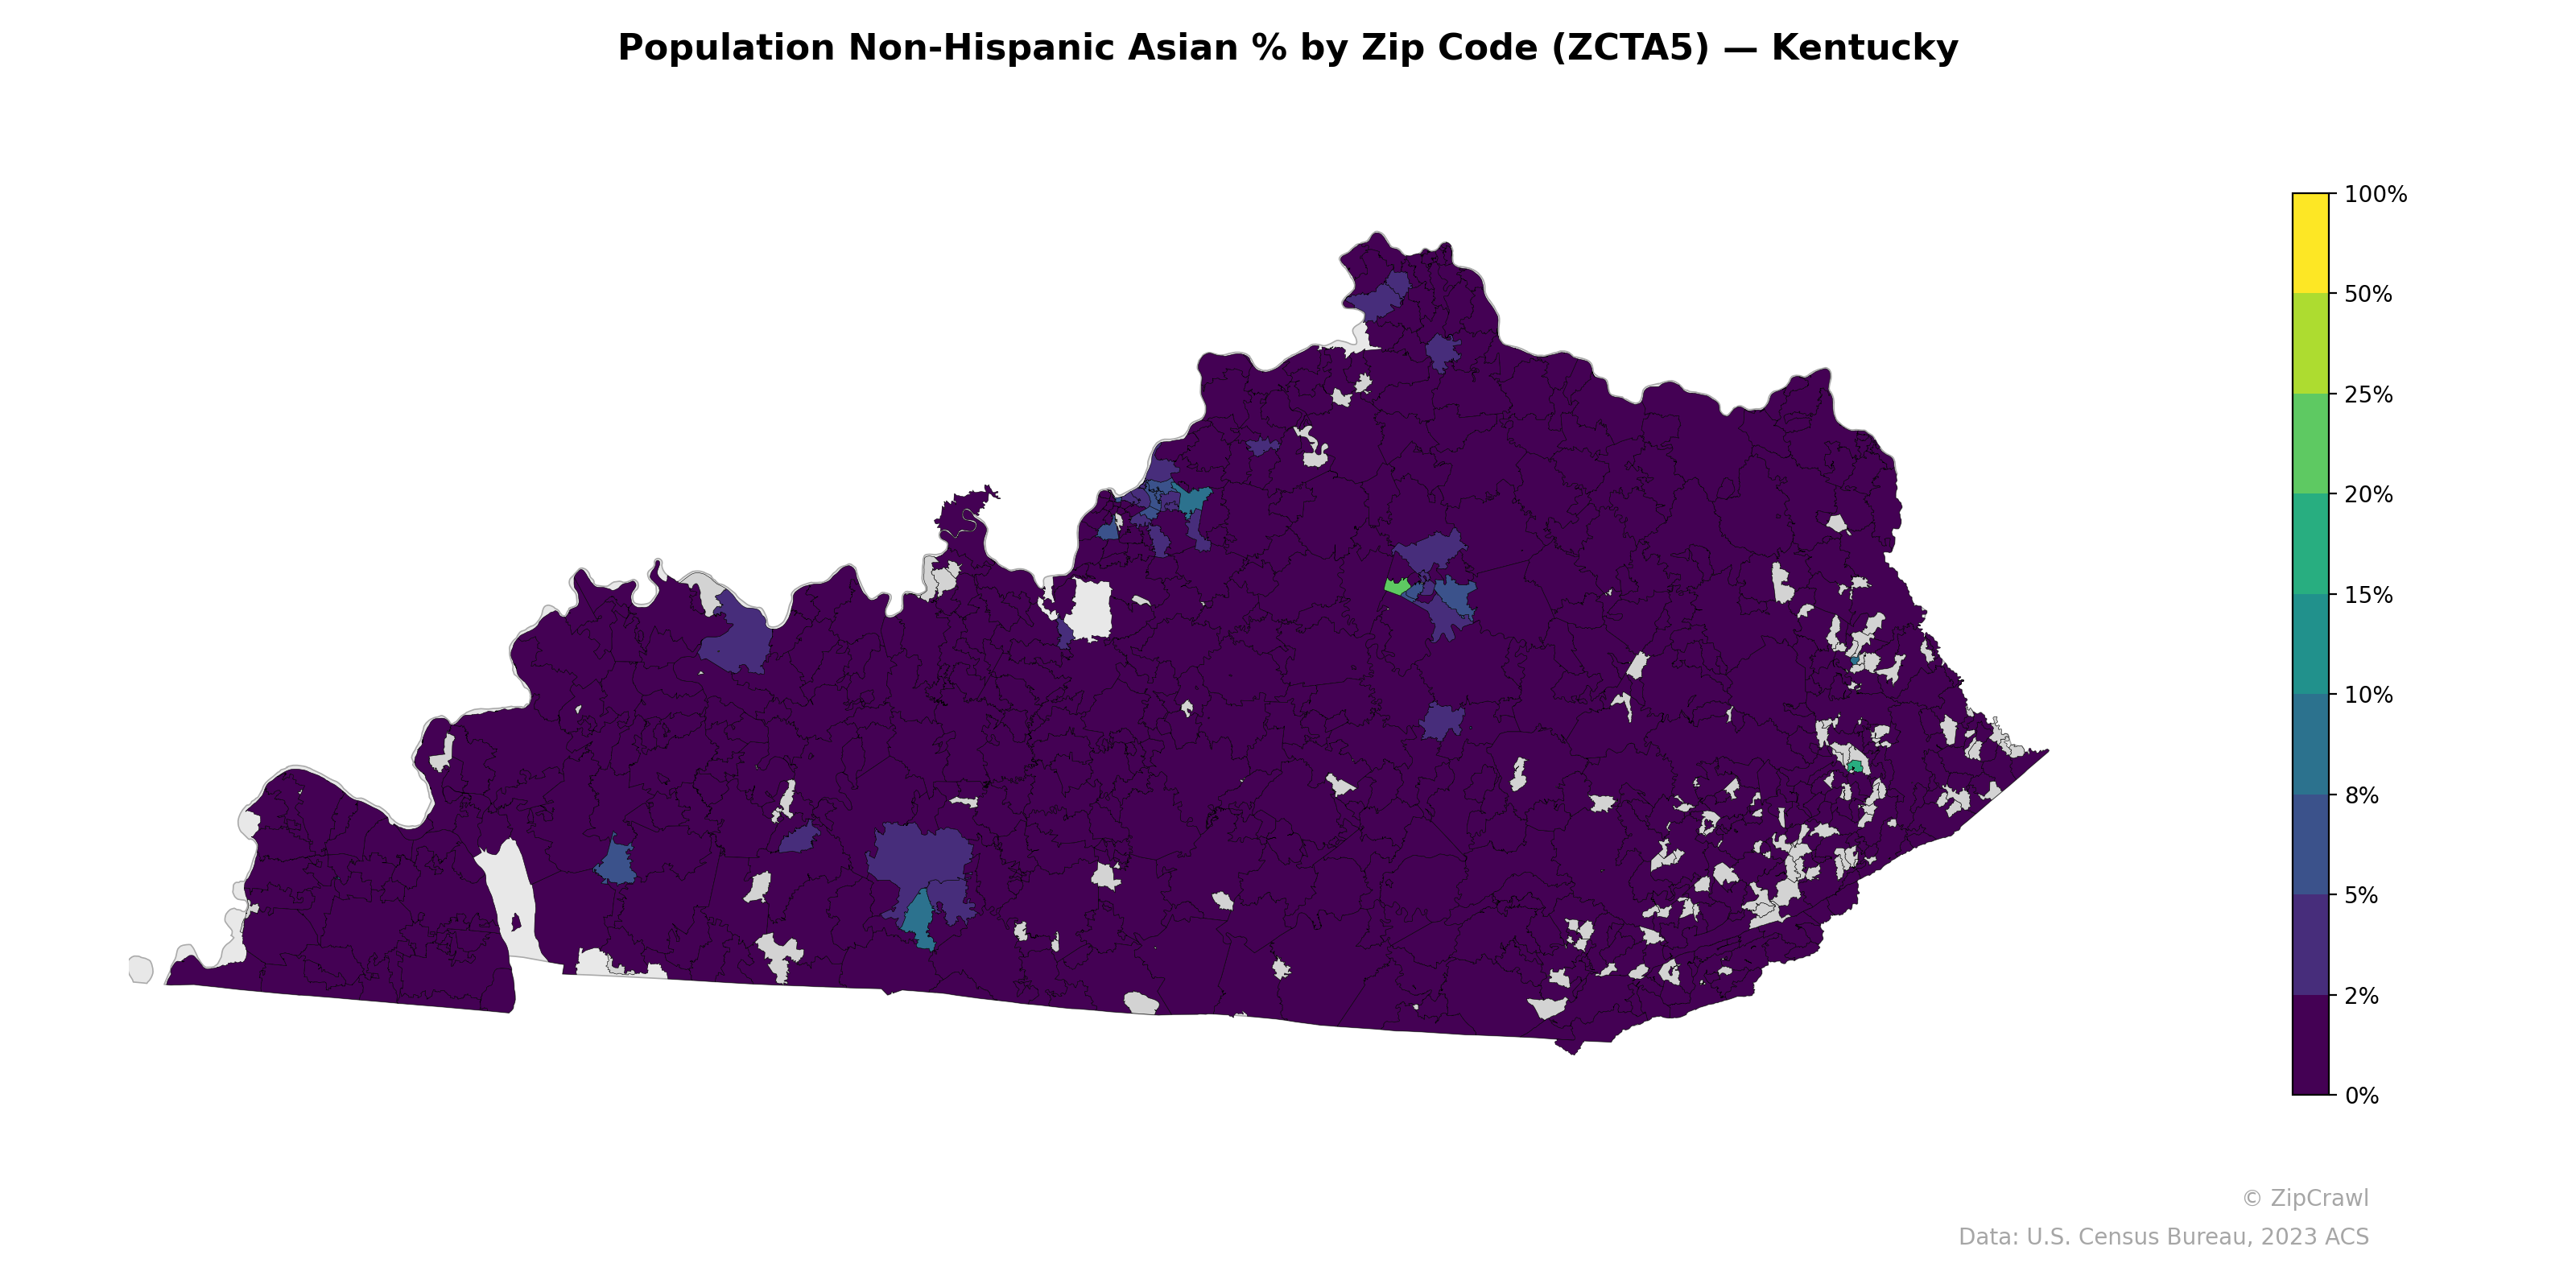
NOTE: Gray indicates insufficient data or a suppressed estimate.
The highest concentrations of Non-Hispanic Asian residents in Kentucky cluster around the Louisville metro area and the Lexington-Frankfort corridor in the north-central part of the state, with several zip codes in these urban centers reaching approximately 5–15% or higher. Scattered pockets of moderate Asian population share also appear near Bowling Green in the south-central region, likely reflecting refugee resettlement patterns, as well as around Northern Kentucky communities adjacent to Cincinnati. The vast majority of eastern Kentucky's Appalachian zip codes and rural western Kentucky register near 0%, creating a stark urban-rural divide in Asian population distribution across the state.
Data: U.S. Census Bureau, 2023 ACS
Explore
- Population Non-Hispanic White % by Zip Code (ZCTA5) — California
- Married Couple (% of all Households) by Zip Code (ZCTA5) — Kentucky
- % of Population on Food Stamps or SNAP (Last 12 Months), by Zip Code (ZCTA5) — Kentucky
- Housing Vacancy Rate by Zip Code (ZCTA5) — Kentucky
- % of Households with Broadband Internet, by County
- % of Population on Food Stamps or SNAP (Last 12 Months), by Zip Code (ZCTA5) — Texas
- U.S. Citizens (% of Population Over 18) by Zip Code (ZCTA5) — California
- Population Non-Hispanic American Indian % by Zip Code (ZCTA5) — California
- Population Hispanic % by Zip Code (ZCTA5) — California
- High School Graduate (% of Over 25) by Zip Code (ZCTA5) — California
- Median Age by Zip Code (ZCTA5) — California
- % of Population without Health Insurance, by Zip Code (ZCTA5) — New York
- Population Non-Hispanic Black % by Zip Code (ZCTA5) — California
- Household Median Income by Zip Code (ZCTA5) — California
- Housing Median Monthly Rent ($), by Zip Code (ZCTA5) — Alabama
- Housing Owner-Occupied Median Value ($), by Zip Code (ZCTA5) — Alabama
- Housing % of Units Built Since 2010, by Zip Code (ZCTA5) — Alabama
- Household Average Size by Zip Code (ZCTA5) — Alabama
- Housing Vacancy Rate by Zip Code (ZCTA5) — Alabama
- % of Population without Health Insurance, by Zip Code (ZCTA5) — Alabama
- % of Population on Food Stamps or SNAP (Last 12 Months), by Zip Code (ZCTA5) — Alabama
- Bachelor's Degree or Higher (% of Over 25) by Zip Code (ZCTA5) — Alabama
- Population Non-Hispanic American Indian % by Zip Code (ZCTA5) — Alabama
- High School Graduate (% of Over 25) by Zip Code (ZCTA5) — Alabama
- Population Non-Hispanic White % by Zip Code (ZCTA5) — Louisiana
- % of Households with Broadband Internet, by Zip Code (ZCTA5) — Alabama
- Household Median Income by Zip Code (ZCTA5) — Louisiana
- Housing Owner-Occupied % of Units, by Zip Code (ZCTA5) — Alabama
- Married Couple (% of all Households) by Zip Code (ZCTA5) — Alabama
- U.S. Citizens (% of Population Over 18) by Zip Code (ZCTA5) — Louisiana
- Population Non-Hispanic Asian % by Zip Code (ZCTA5) — Kansas
- Population Non-Hispanic Asian % by Zip Code (ZCTA5) — Iowa
- Population Non-Hispanic Asian % by Zip Code (ZCTA5) — Ohio
- Population Non-Hispanic Asian % by Zip Code (ZCTA5) — Utah
- Population Non-Hispanic Asian % by Zip Code (ZCTA5) — Texas
- Population Non-Hispanic Asian % by Zip Code (ZCTA5) — Idaho
- Population Non-Hispanic Asian % by Zip Code (ZCTA5) — Hawaii
- Population Non-Hispanic Asian % by Zip Code (ZCTA5) — Oregon
- Population Non-Hispanic Asian % by Zip Code (ZCTA5) — Nevada
- Population Non-Hispanic Asian % by Zip Code (ZCTA5) — Maine