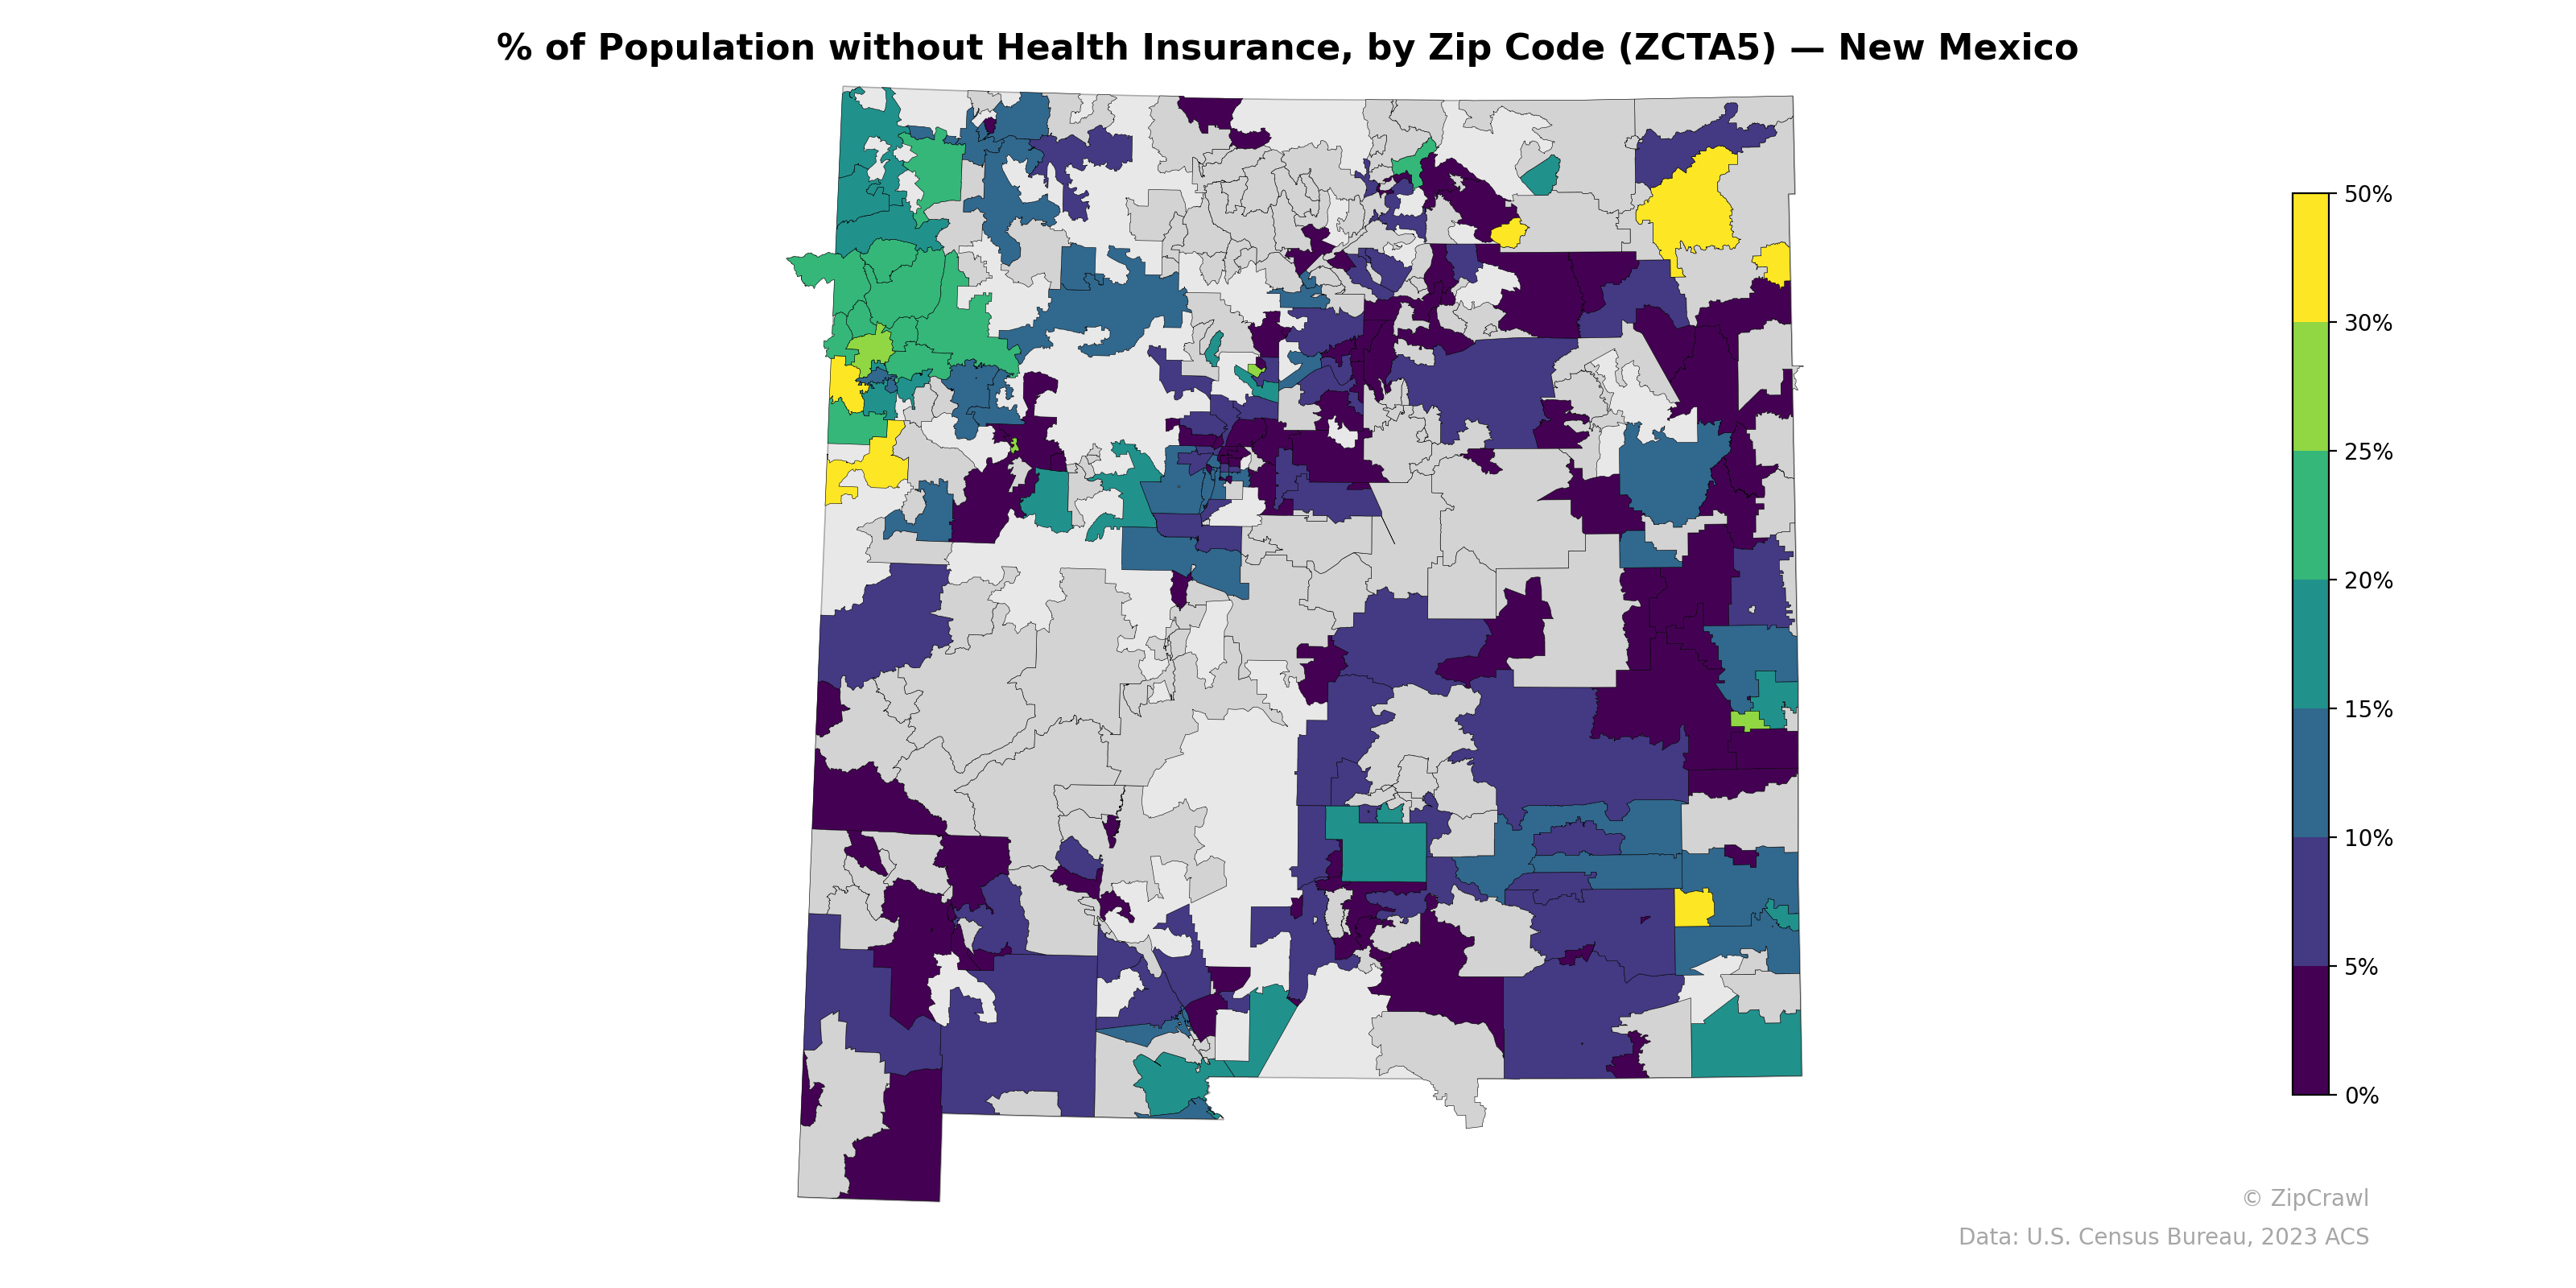
NOTE: Gray indicates insufficient data or a suppressed estimate.
Zip codes in the northwest quadrant of New Mexico—particularly in areas overlapping with tribal nations and the Navajo Nation—display notably elevated uninsured rates, with several zones exceeding 25–35%, while the Albuquerque metro area and surrounding zip codes generally fall in the 5–15% range. A pronounced contrast exists between the southwestern border region, where pockets of very low (near 0%) and very high (30%+) uninsured rates sit adjacent to one another, and the more uniformly moderate rates across the central Rio Grande corridor. The northeastern corner of the state shows a bright yellow outlier exceeding 50%, likely reflecting a small-population zip code with high statistical variability.
Data: U.S. Census Bureau, 2023 ACS
Explore
- Housing Owner-Occupied Median Value ($), by Zip Code (ZCTA5) — Florida
- Population Non-Hispanic American Indian % by Zip Code (ZCTA5) — New Mexico
- Housing Median Monthly Rent ($), by Zip Code (ZCTA5) — New Mexico
- Bachelor's Degree or Higher (% of Over 25) by Zip Code (ZCTA5) — New Mexico
- Housing % of Units Built Since 2010, by Zip Code (ZCTA5) — New Mexico
- Household Average Size by Zip Code (ZCTA5) — New Mexico
- Housing Owner-Occupied Median Value ($), by Zip Code (ZCTA5) — New Mexico
- Housing Owner-Occupied % of Units, by Zip Code (ZCTA5) — New Mexico
- % of Households with Broadband Internet, by Zip Code (ZCTA5) — New Mexico
- High School Graduate (% of Over 25) by Zip Code (ZCTA5) — New Mexico
- Housing Median Monthly Rent ($), by County
- Median Age by Zip Code (ZCTA5) — New York
- Housing Vacancy Rate by Zip Code (ZCTA5) — Florida
- Median Age by Zip Code (ZCTA5) — New Jersey
- Housing Median Monthly Rent ($), by Zip Code (ZCTA5) — Florida
- Housing % of Units Built Since 2010, by Zip Code (ZCTA5) — Florida
- Housing Owner-Occupied % of Units, by Zip Code (ZCTA5) — Florida
- Household Average Size by Zip Code (ZCTA5) — Florida
- Bachelor's Degree or Higher (% of Over 25) by Zip Code (ZCTA5) — Florida
- % of Households with Broadband Internet, by Zip Code (ZCTA5) — Florida
- Married Couple (% of all Households) by Zip Code (ZCTA5) — Florida
- % of Population on Food Stamps or SNAP (Last 12 Months), by Zip Code (ZCTA5) — Mississippi
- % of Households with Broadband Internet, by Zip Code (ZCTA5) — Mississippi
- U.S. Citizens (% of Population Over 18) by Zip Code (ZCTA5) — Kansas
- Housing Owner-Occupied % of Units, by Zip Code (ZCTA5) — Mississippi
- Median Age by Zip Code (ZCTA5) — Idaho
- High School Graduate (% of Over 25) by Zip Code (ZCTA5) — Mississippi
- Population Non-Hispanic American Indian % by Zip Code (ZCTA5) — Mississippi
- Bachelor's Degree or Higher (% of Over 25) by Zip Code (ZCTA5) — Mississippi
- Population Non-Hispanic Asian % by Zip Code (ZCTA5) — Mississippi
- % of Population without Health Insurance, by Zip Code (ZCTA5) — New York
- % of Population without Health Insurance, by Zip Code (ZCTA5) — New York Metro
- % of Population without Health Insurance, by Zip Code (ZCTA5) — New Jersey
- % of Population without Health Insurance, by Zip Code (ZCTA5) — Nevada
- % of Population without Health Insurance, by Zip Code (ZCTA5) — Maine
- % of Population without Health Insurance, by Zip Code (ZCTA5) — New Hampshire
- % of Population without Health Insurance, by Zip Code (ZCTA5) — Iowa
- % of Population without Health Insurance, by Zip Code (ZCTA5) — Ohio
- % of Population without Health Insurance, by Zip Code (ZCTA5) — Nebraska
- % of Population without Health Insurance, by Zip Code (ZCTA5) — Utah