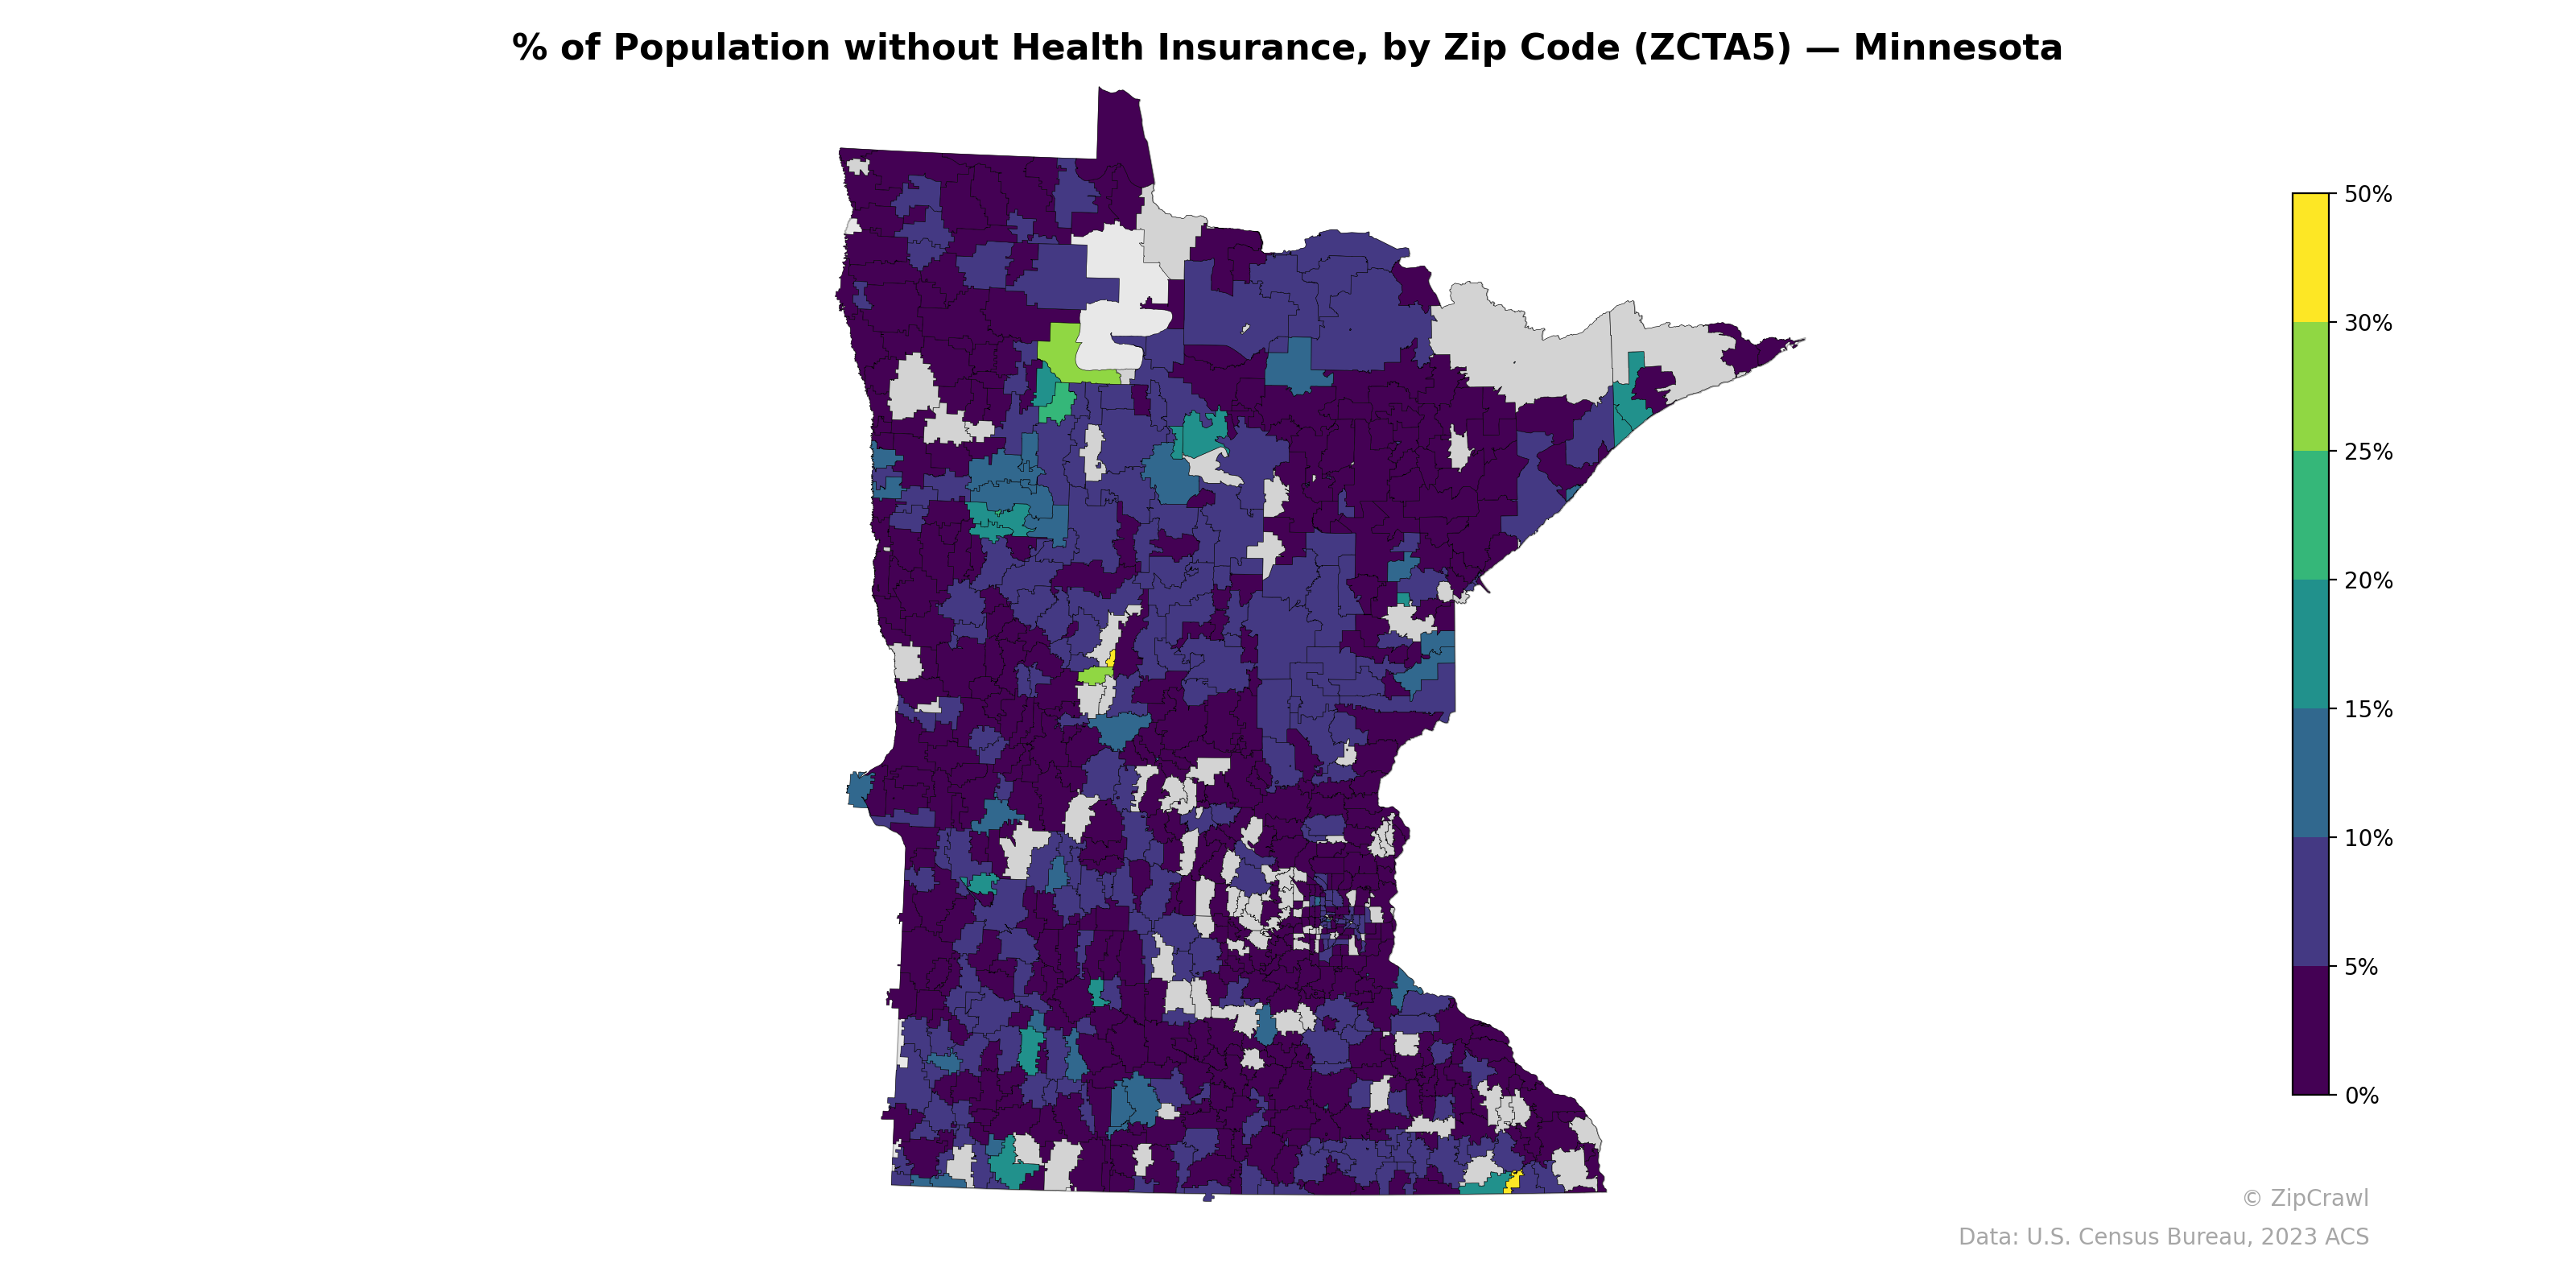
NOTE: Gray indicates insufficient data or a suppressed estimate.
Much of Minnesota maintains relatively low uninsured rates below 5%, particularly in the Twin Cities metropolitan area and suburban zip codes in the southern portion of the state. Elevated uninsured rates of 15–30% cluster in north-central Minnesota, likely corresponding to tribal nations and rural communities with limited employer-sponsored coverage, with additional pockets of higher uninsurance visible in parts of the western border region. The northeastern Arrowhead region displays a mix of moderate uninsured rates alongside gray areas indicating insufficient data, likely reflecting sparse population in those zip codes.
Data: U.S. Census Bureau, 2023 ACS
Explore
- Housing % of Units Built Since 2010, by Zip Code (ZCTA5) — Minnesota
- Housing Owner-Occupied Median Value ($), by Zip Code (ZCTA5) — Minnesota
- % of Households with Broadband Internet, by Zip Code (ZCTA5) — Minnesota
- High School Graduate (% of Over 25) by Zip Code (ZCTA5) — Minnesota
- Housing Median Monthly Rent ($), by Zip Code (ZCTA5) — Minnesota
- Bachelor's Degree or Higher (% of Over 25) by Zip Code (ZCTA5) — Minnesota
- Housing Owner-Occupied % of Units, by Zip Code (ZCTA5) — Minnesota
- Population Non-Hispanic American Indian % by Zip Code (ZCTA5) — Minnesota
- Household Average Size by Zip Code (ZCTA5) — Minnesota
- Bachelor's Degree or Higher (% of Over 25) by County
- Household Average Size by Zip Code (ZCTA5) — Texas
- Housing Owner-Occupied Median Value ($), by Zip Code (ZCTA5) — Texas
- Bachelor's Degree or Higher (% of Over 25) by Zip Code (ZCTA5) — Texas
- Housing % of Units Built Since 2010, by Zip Code (ZCTA5) — Texas
- Housing Vacancy Rate by Zip Code (ZCTA5) — Texas
- Housing Median Monthly Rent ($), by Zip Code (ZCTA5) — Texas
- % of Households with Broadband Internet, by Zip Code (ZCTA5) — Texas
- Housing Owner-Occupied % of Units, by Zip Code (ZCTA5) — Texas
- Population Non-Hispanic White % by Zip Code (ZCTA5) — New York Metro
- Married Couple (% of all Households) by Zip Code (ZCTA5) — Texas
- % of Population on Food Stamps or SNAP (Last 12 Months), by Zip Code (ZCTA5) — Wisconsin
- High School Graduate (% of Over 25) by Zip Code (ZCTA5) — Wisconsin
- U.S. Citizens (% of Population Over 18) by Zip Code (ZCTA5) — Colorado
- Population Non-Hispanic American Indian % by Zip Code (ZCTA5) — Wisconsin
- Population Non-Hispanic Black % by Zip Code (ZCTA5) — Wisconsin
- Population Non-Hispanic White % by Zip Code (ZCTA5) — Wisconsin
- Household Median Income by Zip Code (ZCTA5) — Colorado
- Bachelor's Degree or Higher (% of Over 25) by Zip Code (ZCTA5) — Wisconsin
- Married Couple (% of all Households) by Zip Code (ZCTA5) — Wisconsin
- Median Age by Zip Code (ZCTA5) — Wisconsin
- % of Population without Health Insurance, by Zip Code (ZCTA5) — Maine
- % of Population without Health Insurance, by Zip Code (ZCTA5) — Iowa
- % of Population without Health Insurance, by Zip Code (ZCTA5) — Ohio
- % of Population without Health Insurance, by Zip Code (ZCTA5) — Michigan
- % of Population without Health Insurance, by Zip Code (ZCTA5) — Missouri
- % of Population without Health Insurance, by Zip Code (ZCTA5) — Wyoming
- % of Population without Health Insurance, by Zip Code (ZCTA5) — Oregon
- % of Population without Health Insurance, by Zip Code (ZCTA5) — Idaho
- % of Population without Health Insurance, by Zip Code (ZCTA5) — Utah
- % of Population without Health Insurance, by Zip Code (ZCTA5) — Tennessee