NOTE: Gray indicates insufficient data or a suppressed estimate.
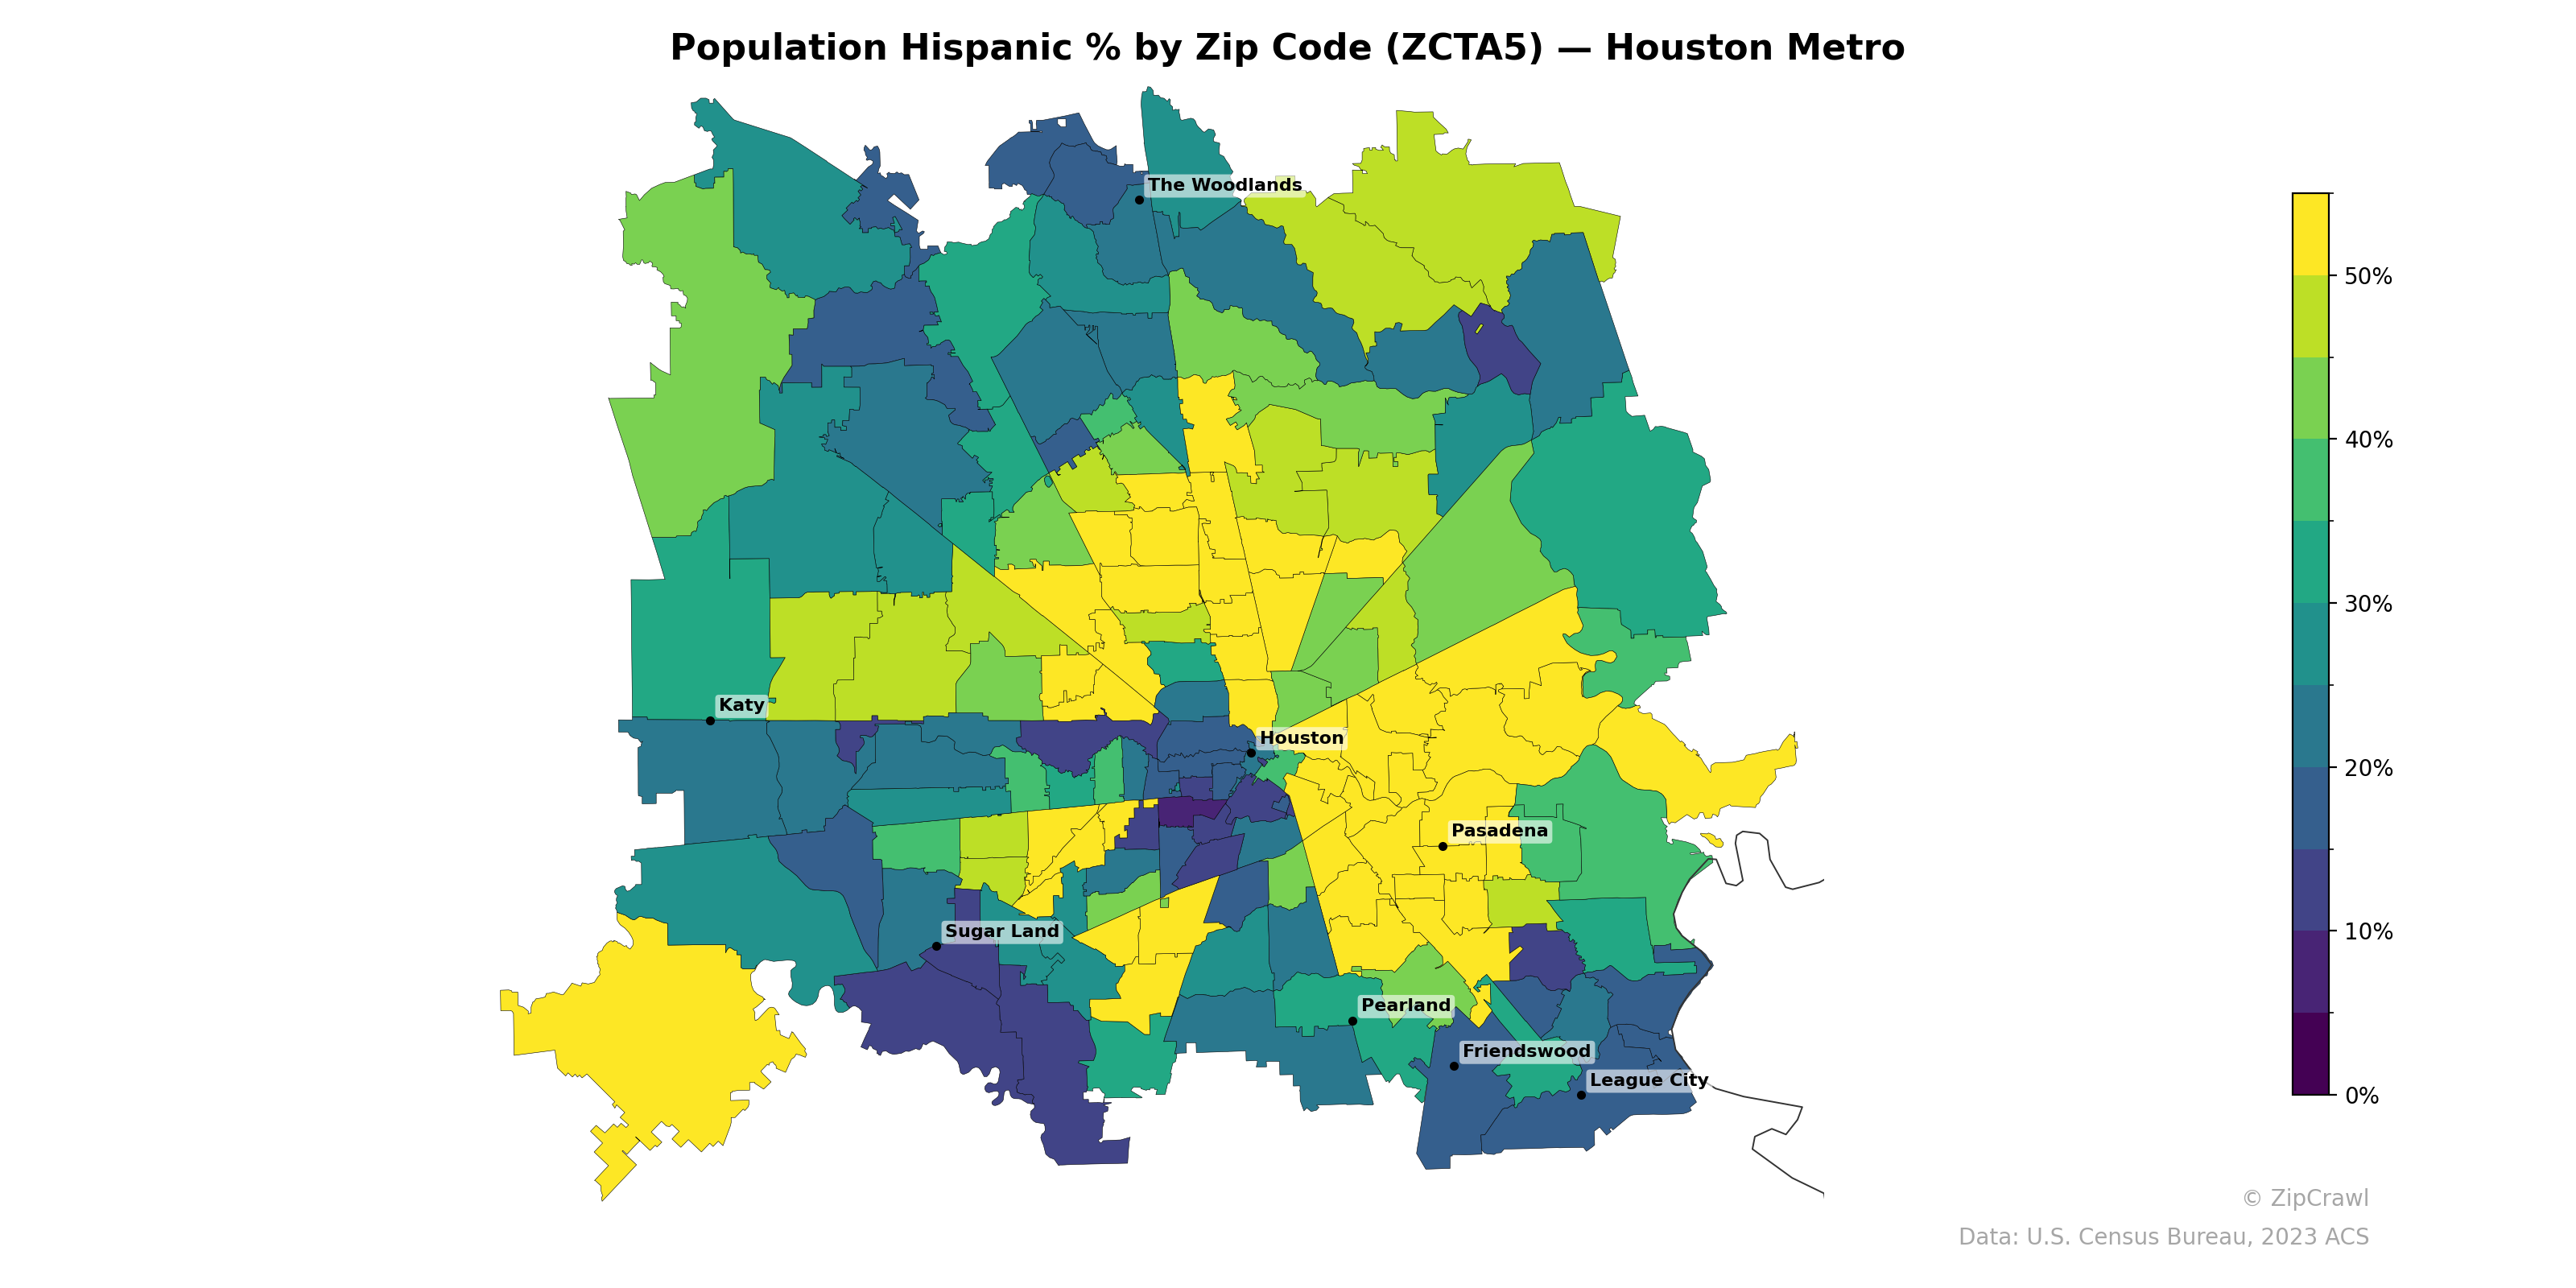
Hispanic population shares in the Houston metro concentrate most heavily in zip codes radiating south and southwest from downtown Houston toward Sugar Land and Pasadena, where many areas exceed 50%, forming a distinct high-density corridor. The northern and outer suburban zip codes—particularly around The Woodlands and the far eastern and western periphery—register notably lower Hispanic percentages, generally in the 15–30% range. A sharp contrast exists between the urban core's yellow-hued zip codes and the teal-to-green outer ring, suggesting a clear center-to-periphery gradient with pockets of lower concentration interspersed near Katy and League City.
Data: U.S. Census Bureau, 2023 ACS
Explore
- Population Non-Hispanic Black % by Zip Code (ZCTA5) — New York Metro
- High School Graduate (% of Over 25) by Zip Code (ZCTA5) — Houston Metro
- Median Age by Zip Code (ZCTA5) — Houston Metro
- Population Non-Hispanic White % by Zip Code (ZCTA5) — Houston Metro
- Population Non-Hispanic American Indian % by Zip Code (ZCTA5) — Houston Metro
- Household Median Income by Zip Code (ZCTA5) — Houston Metro
- Population Non-Hispanic Black % by Zip Code (ZCTA5) — Houston Metro
- % of Population on Food Stamps or SNAP (Last 12 Months), by Zip Code (ZCTA5) — Dallas Metro
- U.S. Citizens (% of Population Over 18) by Zip Code (ZCTA5) — Houston Metro
- Population Non-Hispanic Asian % by Zip Code (ZCTA5) — Dallas Metro
- Housing Owner-Occupied Median Value ($), by Zip Code (ZCTA5) — Nevada
- Median Age by County
- Bachelor's Degree or Higher (% of Over 25) by Zip Code (ZCTA5) — New York Metro
- U.S. Citizens (% of Population Over 18) by Zip Code (ZCTA5) — New York Metro
- Population Non-Hispanic White % by Zip Code (ZCTA5) — New York Metro
- High School Graduate (% of Over 25) by Zip Code (ZCTA5) — New York Metro
- % of Population on Food Stamps or SNAP (Last 12 Months), by County
- Median Age by Zip Code (ZCTA5) — New York Metro
- Household Median Income by Zip Code (ZCTA5) — New York Metro
- Population Non-Hispanic American Indian % by Zip Code (ZCTA5) — New York Metro
- Housing Owner-Occupied Median Value ($), by Zip Code (ZCTA5) — Ohio
- Housing Owner-Occupied % of Units, by Zip Code (ZCTA5) — Ohio
- Housing Median Monthly Rent ($), by Zip Code (ZCTA5) — Ohio
- Population Non-Hispanic American Indian % by Zip Code (ZCTA5) — Ohio
- Population Non-Hispanic Black % by Zip Code (ZCTA5) — Ohio
- High School Graduate (% of Over 25) by Zip Code (ZCTA5) — Ohio
- % of Households with Broadband Internet, by Zip Code (ZCTA5) — Ohio
- % of Population without Health Insurance, by Zip Code (ZCTA5) — Ohio
- Median Age by Zip Code (ZCTA5) — Ohio
- Household Median Income by Zip Code (ZCTA5) — Ohio
- Population Hispanic % by Zip Code (ZCTA5) — Boston Metro
- Population Hispanic % by Zip Code (ZCTA5) — Austin Metro
- Population Hispanic % by Zip Code (ZCTA5) — Miami Metro
- Population Hispanic % by Zip Code (ZCTA5) — Detroit Metro
- Population Hispanic % by Zip Code (ZCTA5) — Tampa Metro
- Population Hispanic % by Zip Code (ZCTA5) — Chicago Metro
- Population Hispanic % by Zip Code (ZCTA5) — Denver Metro
- Population Hispanic % by Zip Code (ZCTA5) — Phoenix Metro
- Population Hispanic % by Zip Code (ZCTA5) — Dallas Metro
- Population Hispanic % by Zip Code (ZCTA5) — Portland Metro