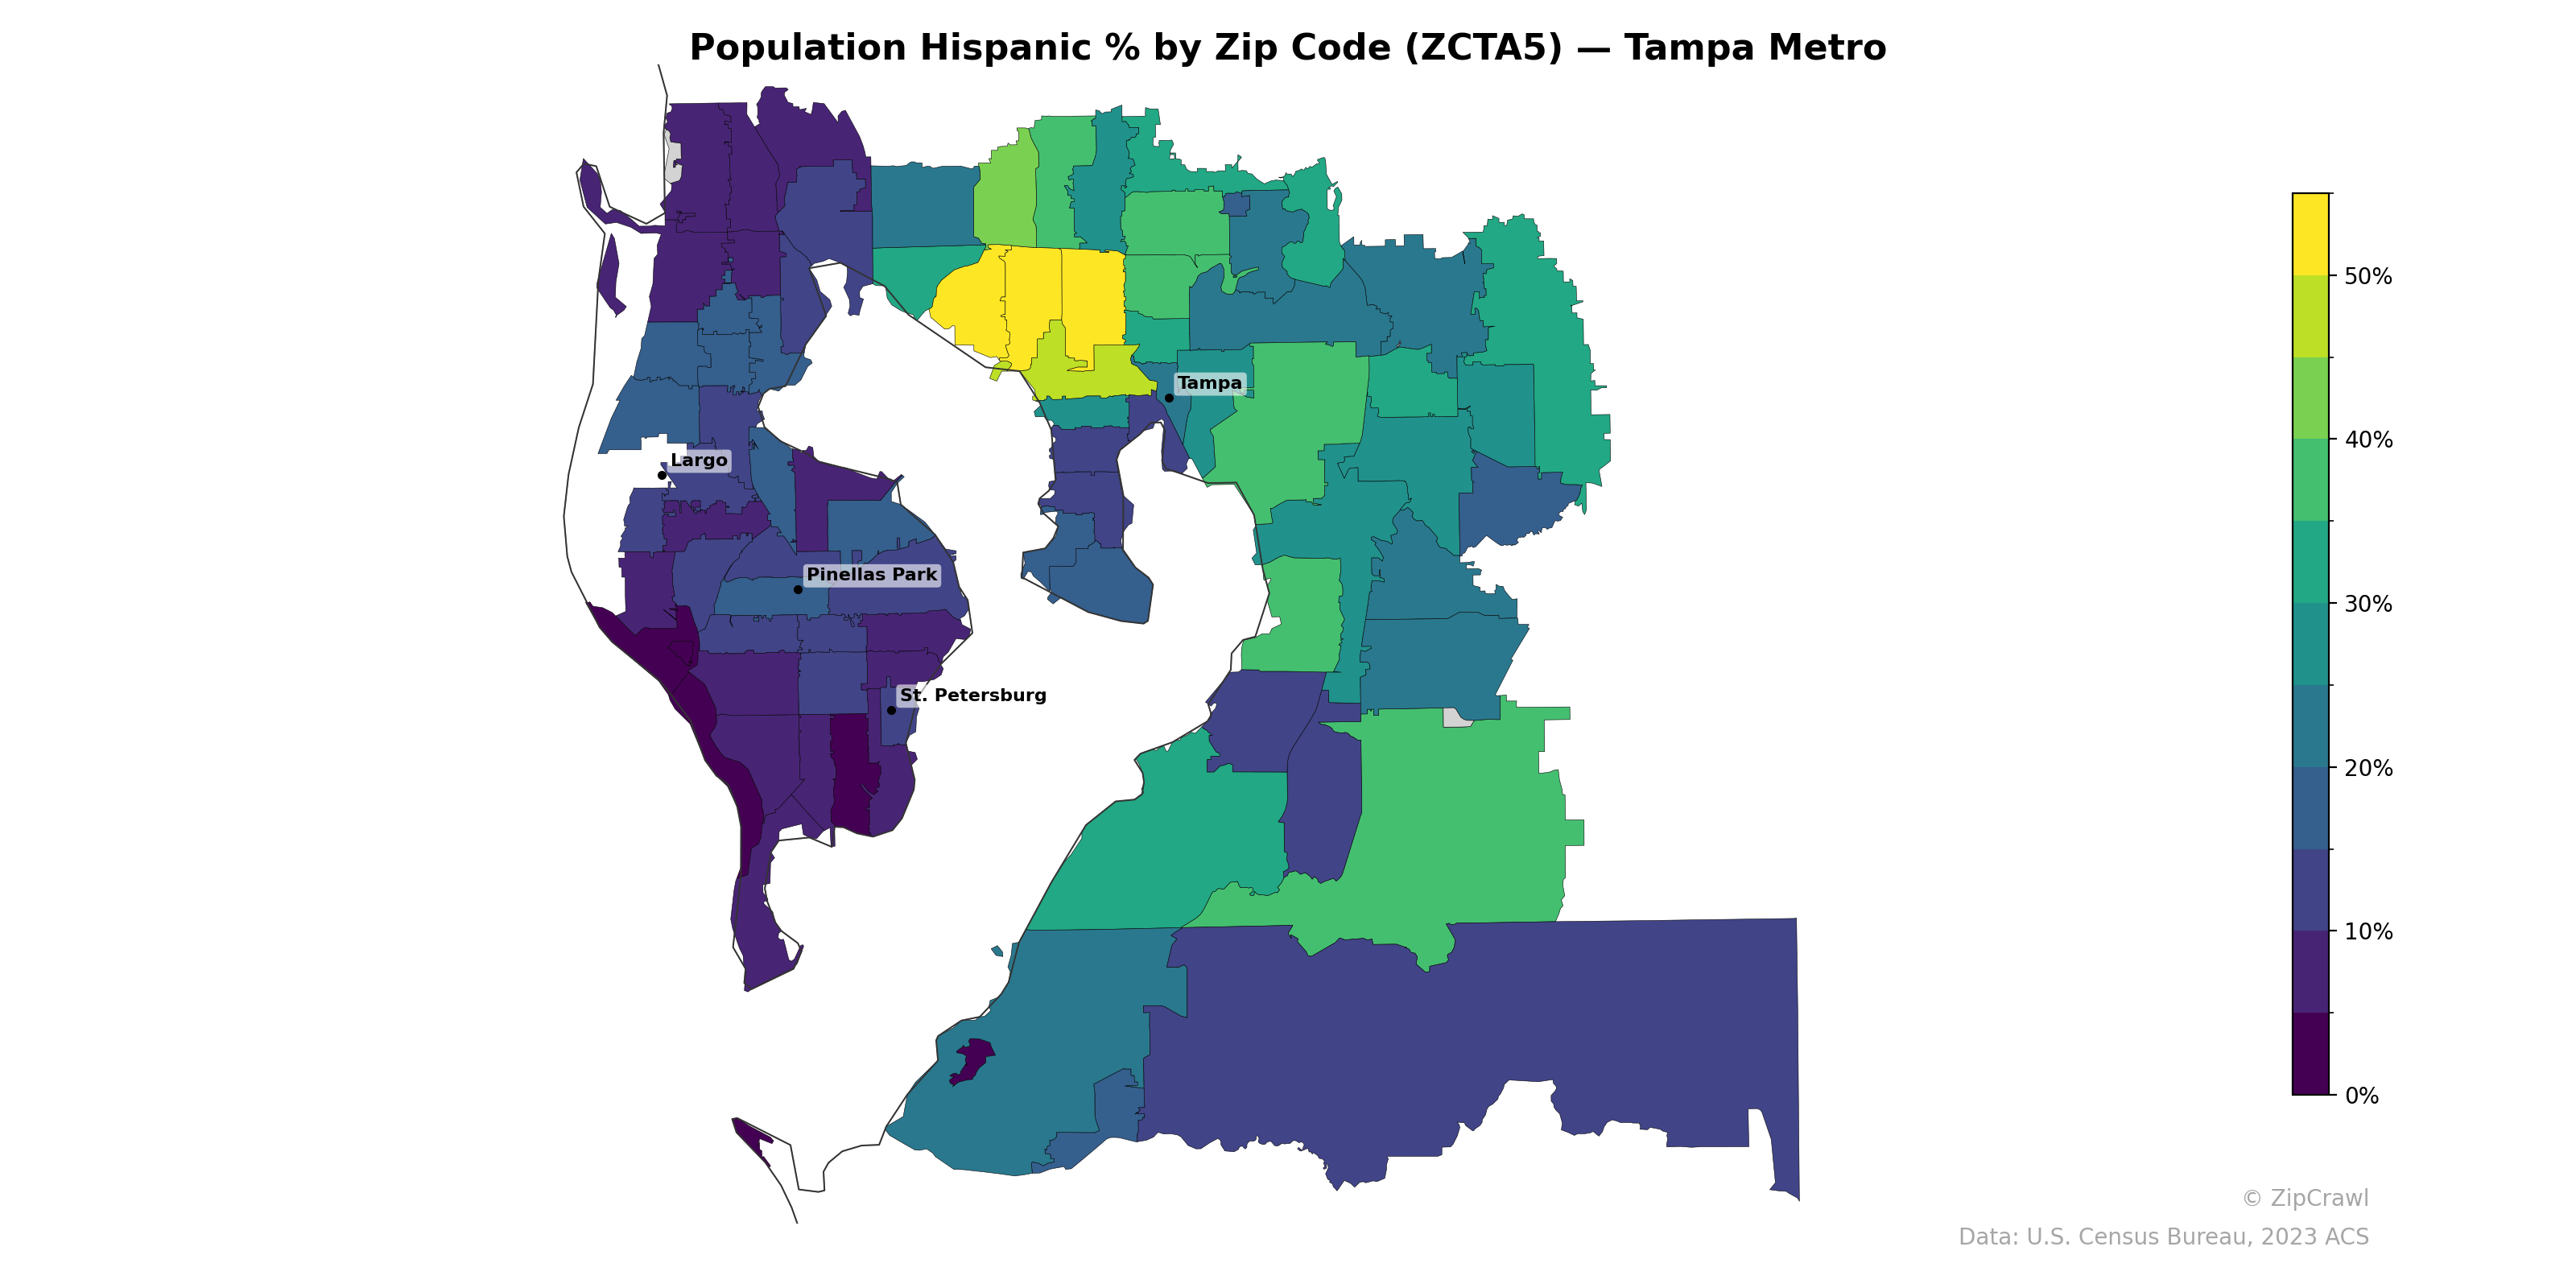
NOTE: Gray indicates insufficient data or a suppressed estimate.
Hispanic population concentration in the Tampa metro peaks in the zip codes just north and northwest of downtown Tampa, where several ZCTAs exceed 50%, forming a distinct cluster likely encompassing the historically Hispanic neighborhoods of West Tampa and Town 'n' Country. The Pinellas County peninsula to the west exhibits markedly lower Hispanic percentages, generally below 15%, with pockets near the southern tip around St. Petersburg dropping to near 0%. A moderate band of 20–30% Hispanic population extends eastward and southward from the Tampa core into Hillsborough County's suburban and rural areas, suggesting outward demographic diffusion from the urban center.
Data: U.S. Census Bureau, 2023 ACS
Explore
- Bachelor's Degree or Higher (% of Over 25) by Zip Code (ZCTA5) — Chicago Metro
- Population Non-Hispanic White % by Zip Code (ZCTA5) — Tampa Metro
- Population Non-Hispanic Asian % by Zip Code (ZCTA5) — Minneapolis Metro
- Median Age by Zip Code (ZCTA5) — Tampa Metro
- High School Graduate (% of Over 25) by Zip Code (ZCTA5) — Tampa Metro
- Population Non-Hispanic Black % by Zip Code (ZCTA5) — Tampa Metro
- U.S. Citizens (% of Population Over 18) by Zip Code (ZCTA5) — Tampa Metro
- % of Population on Food Stamps or SNAP (Last 12 Months), by Zip Code (ZCTA5) — Minneapolis Metro
- Population Non-Hispanic American Indian % by Zip Code (ZCTA5) — Tampa Metro
- Household Median Income by Zip Code (ZCTA5) — Tampa Metro
- Population Non-Hispanic American Indian % by County
- Housing Vacancy Rate by Zip Code (ZCTA5) — Chicago Metro
- Married Couple (% of all Households) by Zip Code (ZCTA5) — Chicago Metro
- Housing Owner-Occupied Median Value ($), by Zip Code (ZCTA5) — Chicago Metro
- Household Average Size by Zip Code (ZCTA5) — Chicago Metro
- % of Households with Broadband Internet, by Zip Code (ZCTA5) — Chicago Metro
- % of Population without Health Insurance, by Zip Code (ZCTA5) — Chicago Metro
- Housing Owner-Occupied % of Units, by Zip Code (ZCTA5) — Chicago Metro
- Housing % of Units Built Since 2010, by Zip Code (ZCTA5) — Chicago Metro
- Housing Median Monthly Rent ($), by Zip Code (ZCTA5) — Chicago Metro
- Housing % of Units Built Since 2010, by Zip Code (ZCTA5) — Denver Metro
- Housing Owner-Occupied % of Units, by Zip Code (ZCTA5) — Denver Metro
- Household Average Size by Zip Code (ZCTA5) — Denver Metro
- Population Non-Hispanic American Indian % by Zip Code (ZCTA5) — Denver Metro
- Population Non-Hispanic Black % by Zip Code (ZCTA5) — Denver Metro
- High School Graduate (% of Over 25) by Zip Code (ZCTA5) — Denver Metro
- % of Households with Broadband Internet, by Zip Code (ZCTA5) — Denver Metro
- % of Population without Health Insurance, by Zip Code (ZCTA5) — Denver Metro
- Housing Owner-Occupied Median Value ($), by Zip Code (ZCTA5) — Denver Metro
- Median Age by Zip Code (ZCTA5) — Denver Metro
- Population Hispanic % by Zip Code (ZCTA5) — Boston Metro
- Population Hispanic % by Zip Code (ZCTA5) — Miami Metro
- Population Hispanic % by Zip Code (ZCTA5) — Detroit Metro
- Population Hispanic % by Zip Code (ZCTA5) — Houston Metro
- Population Hispanic % by Zip Code (ZCTA5) — Denver Metro
- Population Hispanic % by Zip Code (ZCTA5) — Chicago Metro
- Population Hispanic % by Zip Code (ZCTA5) — Austin Metro
- Population Hispanic % by Zip Code (ZCTA5) — Dallas Metro
- Population Hispanic % by Zip Code (ZCTA5) — Phoenix Metro
- Population Hispanic % by Zip Code (ZCTA5) — Portland Metro