NOTE: Gray indicates insufficient data or a suppressed estimate.
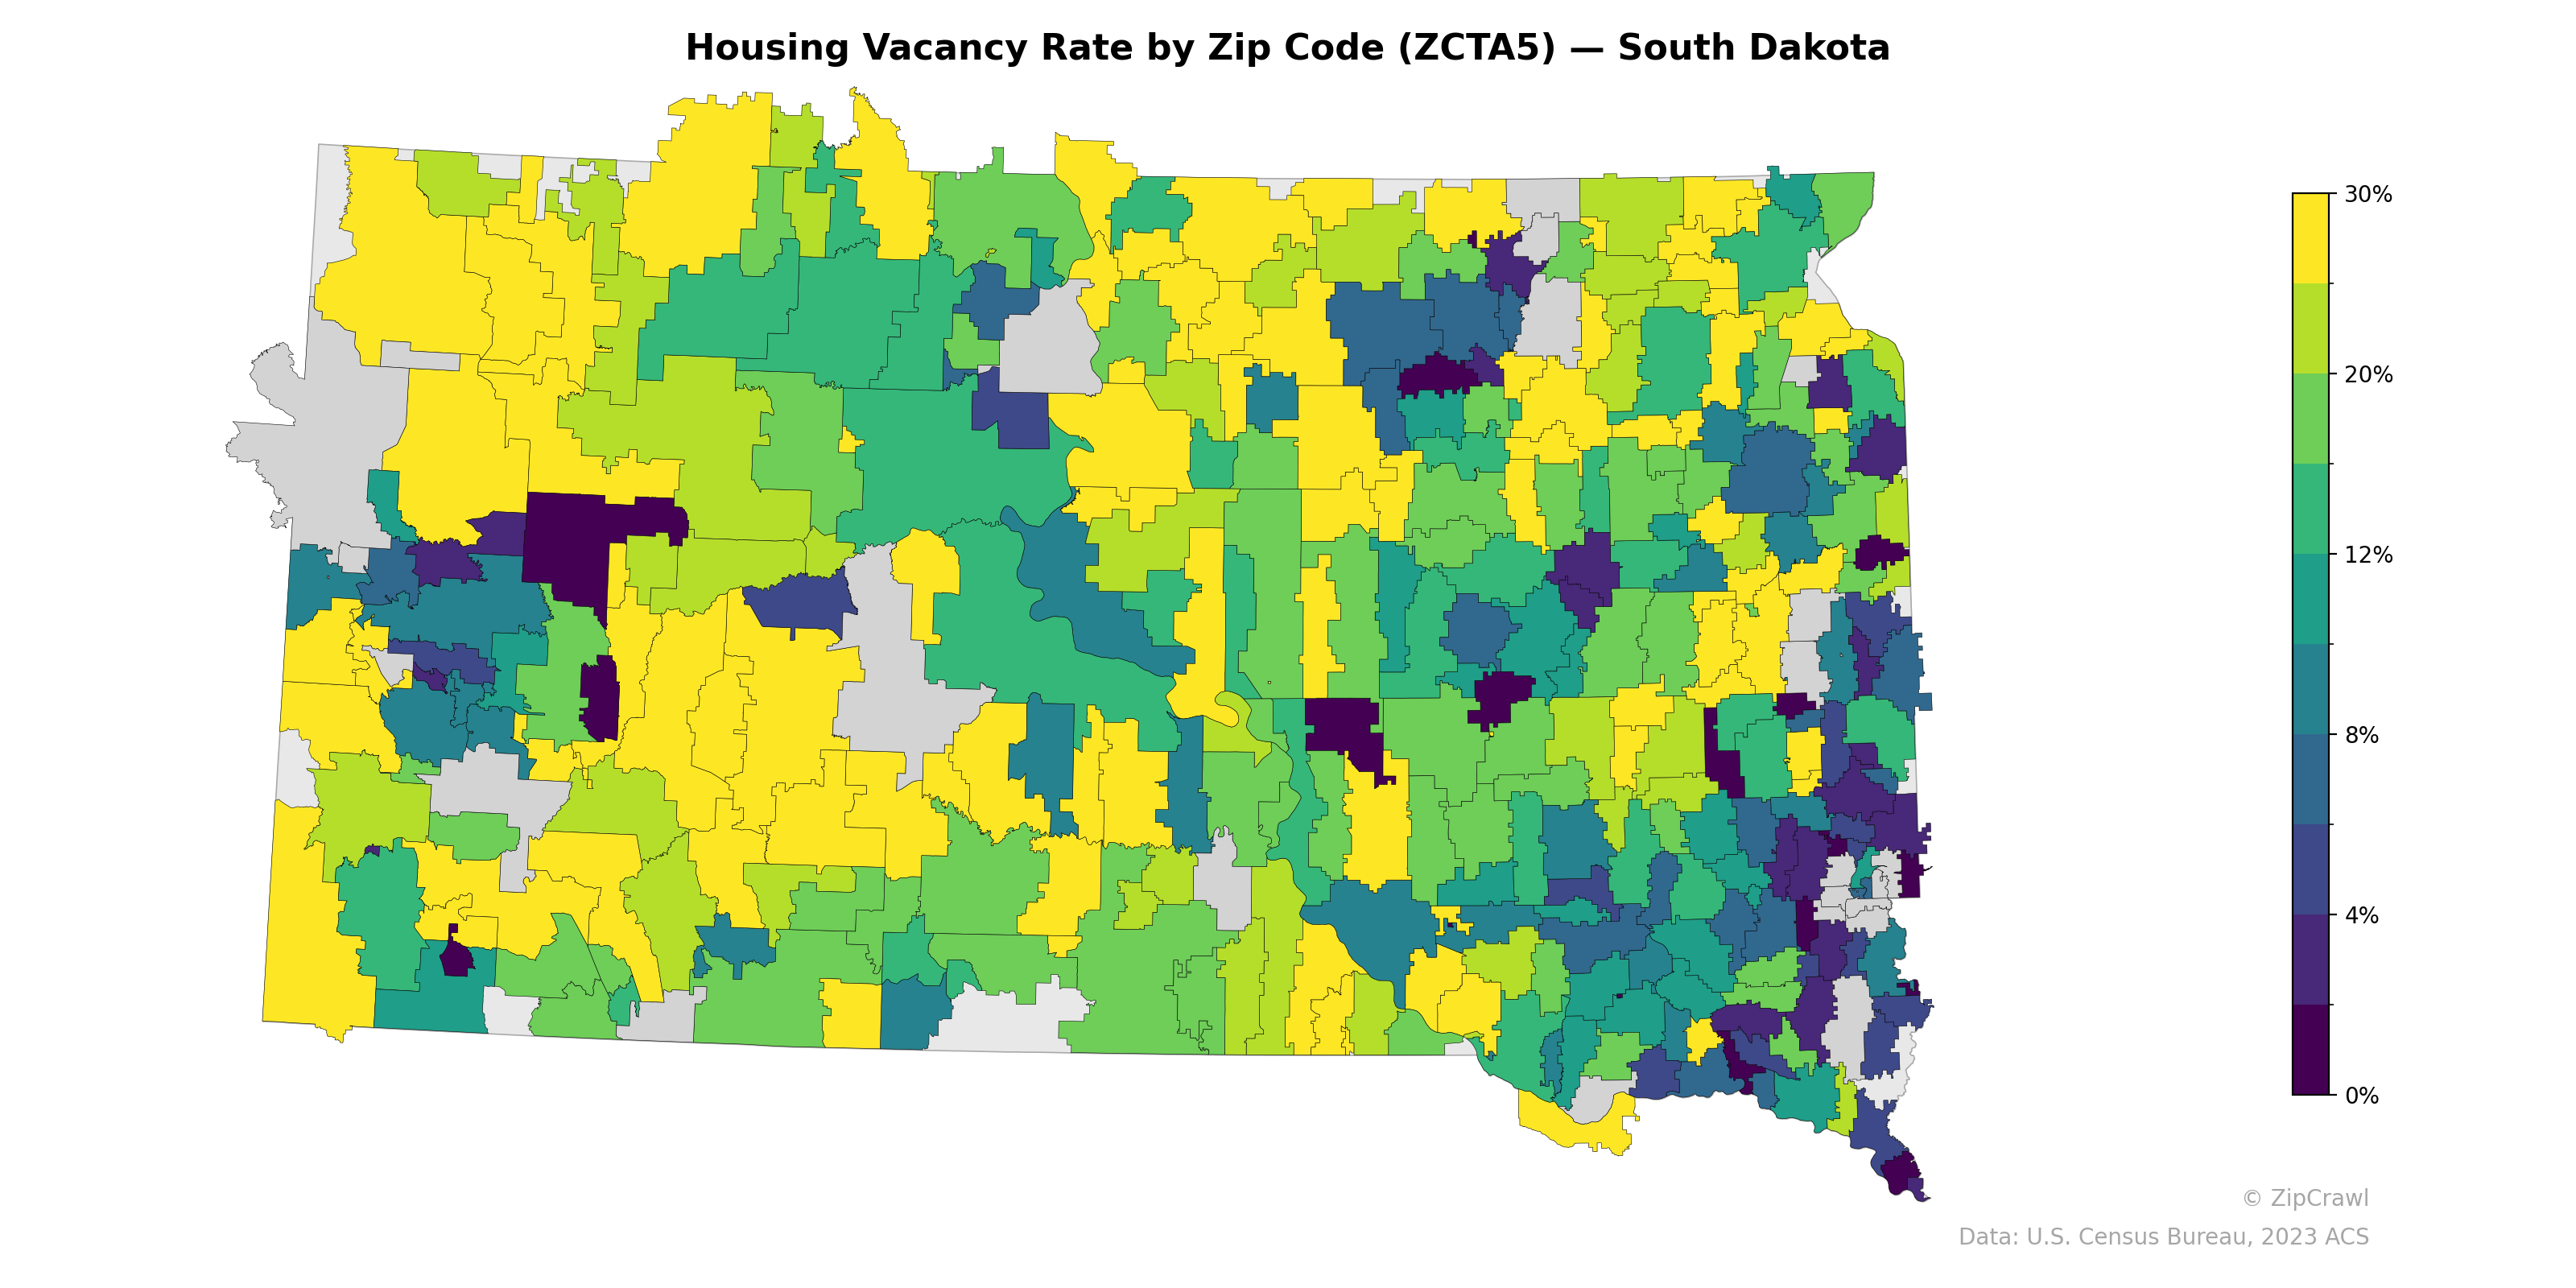
Housing vacancy rates across South Dakota exhibit a pronounced east-west gradient, with the southeastern corner of the state—particularly the Sioux Falls metropolitan area and surrounding zip codes—displaying consistently low vacancy rates near 0–4%, indicative of tight housing markets. The western and central portions of the state are dominated by higher vacancy rates in the 16–30% range, likely reflecting rural depopulation and the presence of seasonal or recreational housing near areas such as the Black Hills. Several isolated zip codes with very low vacancy rates (dark purple) appear scattered in unexpected rural locations, potentially corresponding to reservation communities or small towns with constrained housing stock.
Data: U.S. Census Bureau, 2023 ACS
Explore
- Housing Median Monthly Rent ($), by Zip Code (ZCTA5) — New York
- % of Households with Broadband Internet, by Zip Code (ZCTA5) — New York
- U.S. Citizens (% of Population Over 18) by Zip Code (ZCTA5) — North Dakota
- Married Couple (% of all Households) by Zip Code (ZCTA5) — South Dakota
- Population Non-Hispanic Black % by Zip Code (ZCTA5) — North Dakota
- Population Hispanic % by Zip Code (ZCTA5) — North Dakota
- Household Median Income by Zip Code (ZCTA5) — North Dakota
- Median Age by Zip Code (ZCTA5) — North Dakota
- Population Non-Hispanic Asian % by Zip Code (ZCTA5) — South Dakota
- % of Population on Food Stamps or SNAP (Last 12 Months), by Zip Code (ZCTA5) — South Dakota
- Population Non-Hispanic White % by Zip Code (ZCTA5) — North Dakota
- Household Average Size by County
- % of Households with Broadband Internet, by Zip Code (ZCTA5) — Indiana
- Housing % of Units Built Since 2010, by Zip Code (ZCTA5) — New York
- Housing Owner-Occupied Median Value ($), by Zip Code (ZCTA5) — New York
- Household Average Size by Zip Code (ZCTA5) — New York
- Bachelor's Degree or Higher (% of Over 25) by Zip Code (ZCTA5) — New York
- % of Population without Health Insurance, by Zip Code (ZCTA5) — New York
- Married Couple (% of all Households) by Zip Code (ZCTA5) — New York
- Housing Owner-Occupied % of Units, by Zip Code (ZCTA5) — New York
- Bachelor's Degree or Higher (% of Over 25) by Zip Code (ZCTA5) — Rhode Island
- % of Households with Broadband Internet, by Zip Code (ZCTA5) — Rhode Island
- % of Population on Food Stamps or SNAP (Last 12 Months), by Zip Code (ZCTA5) — Rhode Island
- % of Population without Health Insurance, by Zip Code (ZCTA5) — Rhode Island
- Married Couple (% of all Households) by Zip Code (ZCTA5) — Rhode Island
- Household Median Income by Zip Code (ZCTA5) — Oregon
- High School Graduate (% of Over 25) by Zip Code (ZCTA5) — Rhode Island
- Population Non-Hispanic American Indian % by Zip Code (ZCTA5) — Rhode Island
- Population Non-Hispanic American Indian % by Zip Code (ZCTA5) — North Dakota
- Population Non-Hispanic Asian % by Zip Code (ZCTA5) — Rhode Island
- Housing Vacancy Rate by Zip Code (ZCTA5) — North Dakota
- Housing Vacancy Rate by Zip Code (ZCTA5) — South Carolina
- Housing Vacancy Rate by Zip Code (ZCTA5) — Utah
- Housing Vacancy Rate by Zip Code (ZCTA5) — Ohio
- Housing Vacancy Rate by Zip Code (ZCTA5) — Iowa
- Housing Vacancy Rate by Zip Code (ZCTA5) — Minnesota
- Housing Vacancy Rate by Zip Code (ZCTA5) — Idaho
- Housing Vacancy Rate by Zip Code (ZCTA5) — Hawaii
- Housing Vacancy Rate by Zip Code (ZCTA5) — Texas
- Housing Vacancy Rate by Zip Code (ZCTA5) — Maine