NOTE: Gray indicates insufficient data or a suppressed estimate.
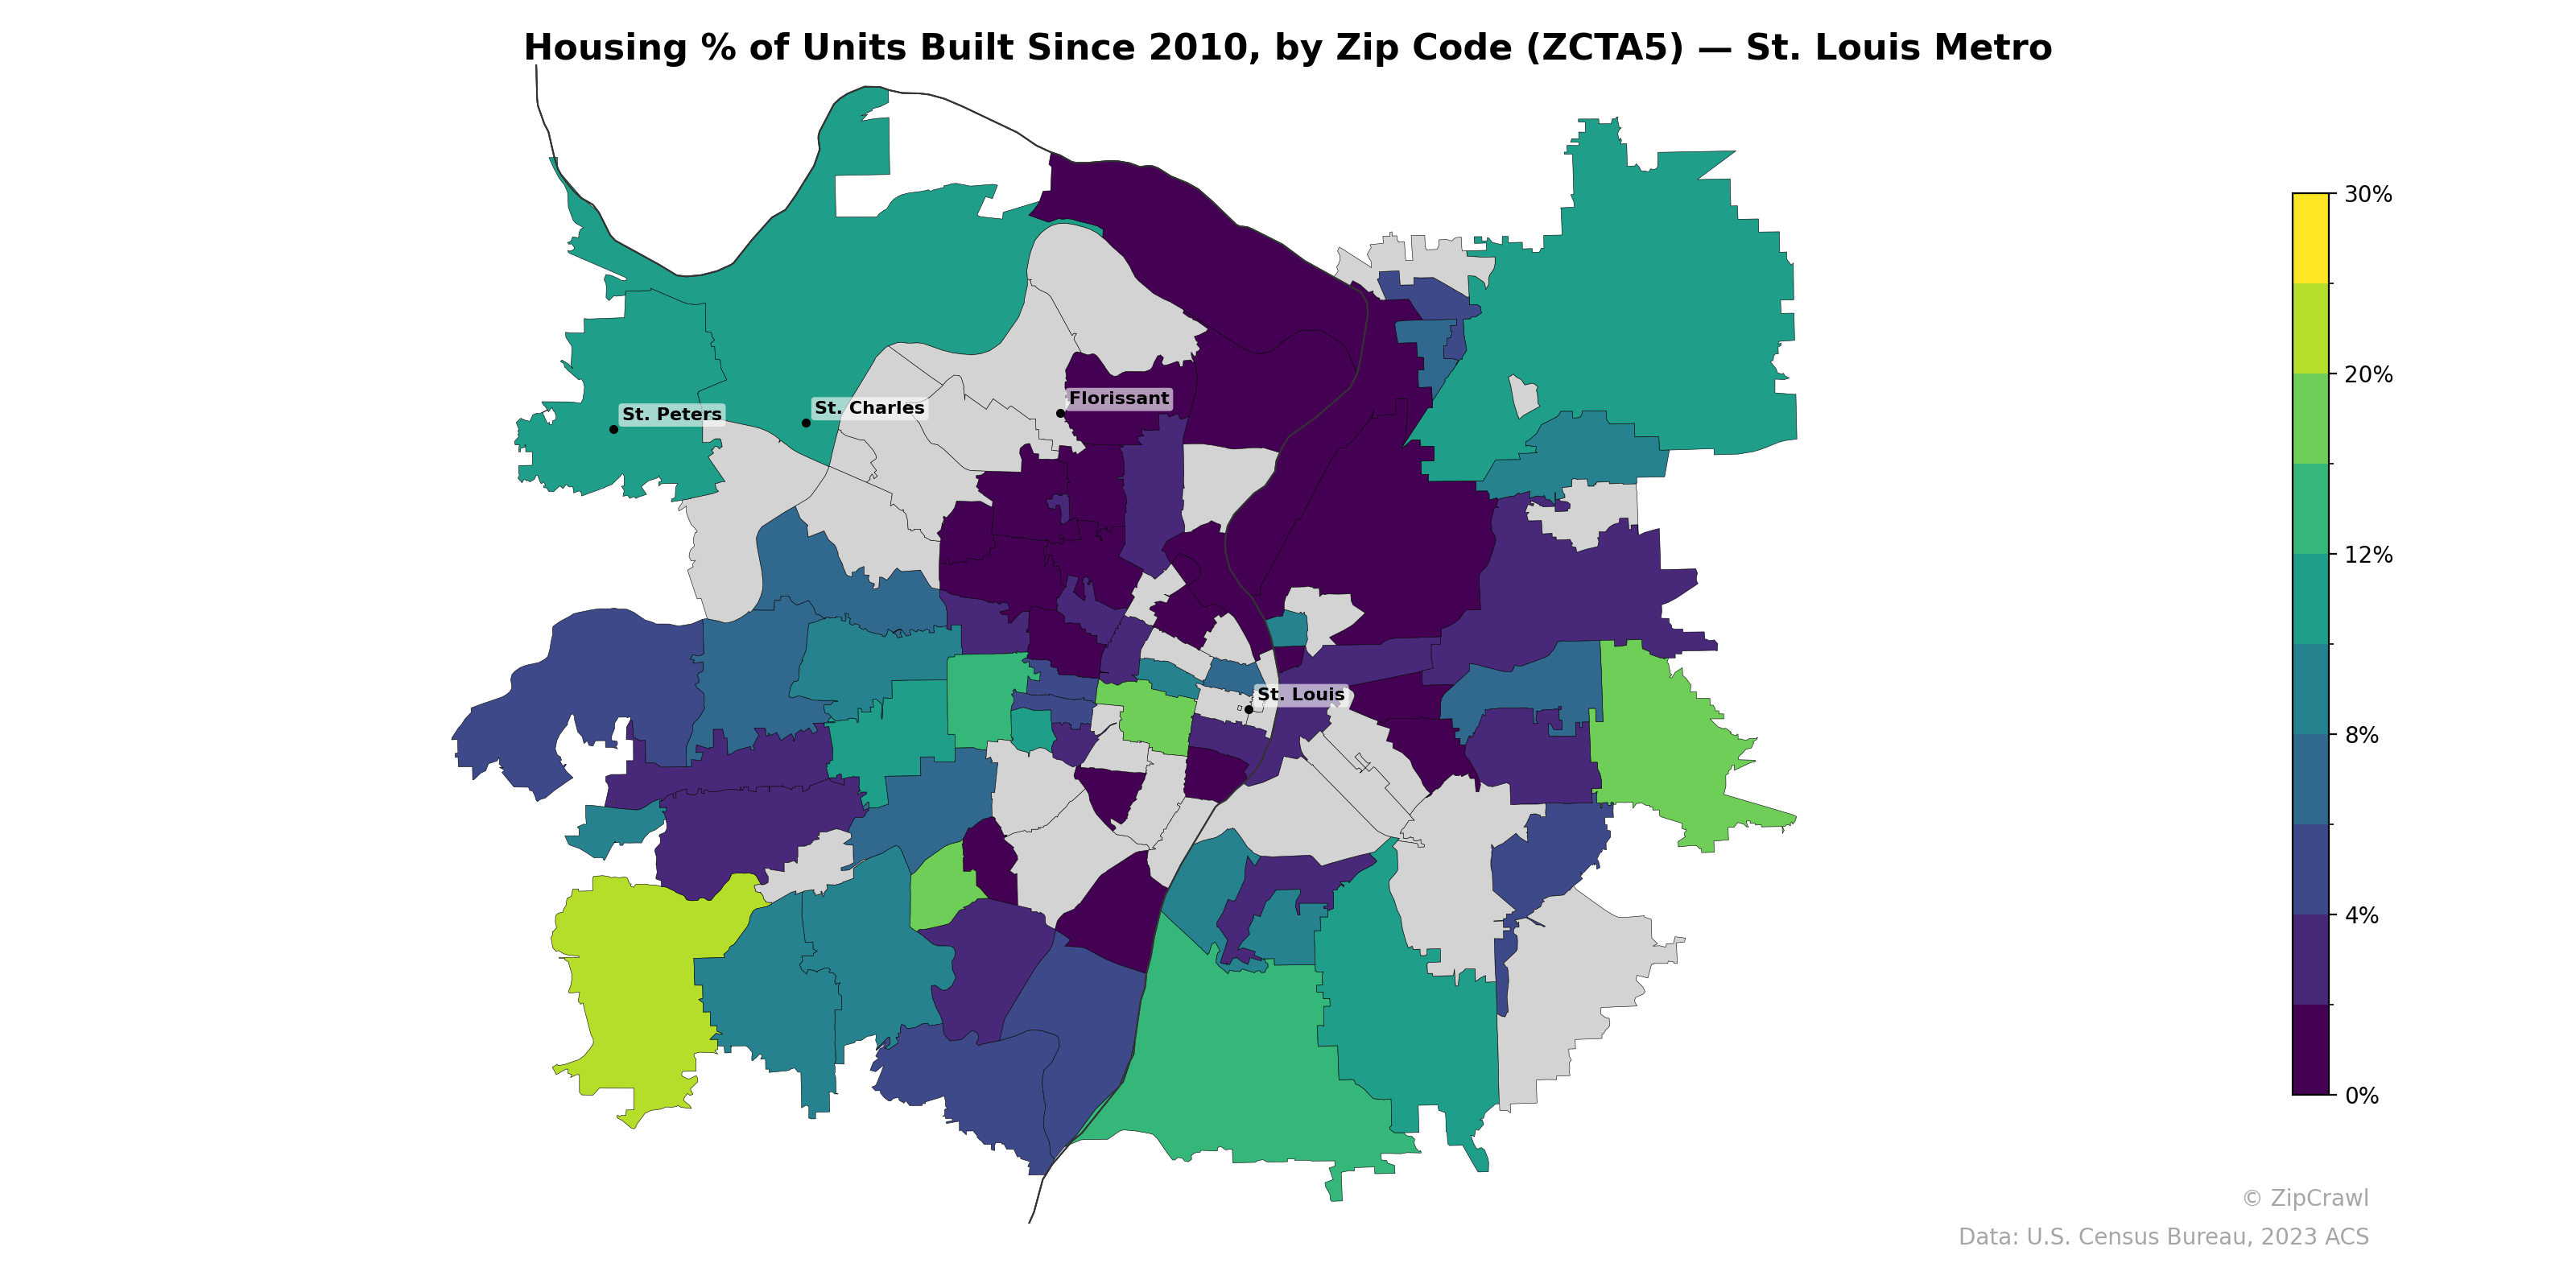
Newer housing construction concentrates heavily along the western and northwestern periphery of the metro, particularly around St. Peters and the outer St. Charles County zip codes, where several areas exceed 20% of units built since 2010. In stark contrast, the urban core surrounding downtown St. Louis and the inner northern suburbs near Florissant show consistently low rates of new construction, often below 4%, reflecting aging housing stock and limited recent development. A secondary cluster of moderate-to-high new construction activity appears in select southern and southeastern fringe zip codes, suggesting outward suburban growth pressure on multiple fronts.
Data: U.S. Census Bureau, 2023 ACS
Explore
- Household Median Income by Zip Code (ZCTA5) — Texas
- Housing Vacancy Rate by Zip Code (ZCTA5) — St. Louis Metro
- % of Population without Health Insurance, by Zip Code (ZCTA5) — St. Louis Metro
- Housing Owner-Occupied % of Units, by Zip Code (ZCTA5) — St. Louis Metro
- Married Couple (% of all Households) by Zip Code (ZCTA5) — St. Louis Metro
- Housing Owner-Occupied Median Value ($), by Zip Code (ZCTA5) — St. Louis Metro
- Housing Median Monthly Rent ($), by Zip Code (ZCTA5) — St. Louis Metro
- % of Households with Broadband Internet, by Zip Code (ZCTA5) — St. Louis Metro
- Household Average Size by Zip Code (ZCTA5) — St. Louis Metro
- Bachelor's Degree or Higher (% of Over 25) by Zip Code (ZCTA5) — St. Louis Metro
- High School Graduate (% of Over 25) by County
- Population Non-Hispanic White % by Zip Code (ZCTA5) — Texas
- U.S. Citizens (% of Population Over 18) by Zip Code (ZCTA5) — Texas
- Population Non-Hispanic Asian % by Zip Code (ZCTA5) — Chicago Metro
- Household Average Size by Zip Code (ZCTA5) — New York Metro
- % of Population on Food Stamps or SNAP (Last 12 Months), by Zip Code (ZCTA5) — Chicago Metro
- Population Non-Hispanic Black % by Zip Code (ZCTA5) — Texas
- Population Hispanic % by Zip Code (ZCTA5) — Texas
- Population Non-Hispanic American Indian % by Zip Code (ZCTA5) — Texas
- Median Age by Zip Code (ZCTA5) — Texas
- High School Graduate (% of Over 25) by Zip Code (ZCTA5) — Texas
- % of Households with Broadband Internet, by Zip Code (ZCTA5) — Baltimore Metro
- Bachelor's Degree or Higher (% of Over 25) by Zip Code (ZCTA5) — Baltimore Metro
- % of Population without Health Insurance, by Zip Code (ZCTA5) — Baltimore Metro
- Population Non-Hispanic Asian % by Zip Code (ZCTA5) — Charlotte Metro
- Population Non-Hispanic Asian % by Zip Code (ZCTA5) — Baltimore Metro
- Household Median Income by Zip Code (ZCTA5) — Baltimore Metro
- High School Graduate (% of Over 25) by Zip Code (ZCTA5) — Baltimore Metro
- % of Population on Food Stamps or SNAP (Last 12 Months), by Zip Code (ZCTA5) — Charlotte Metro
- Population Non-Hispanic Black % by Zip Code (ZCTA5) — Baltimore Metro
- Housing % of Units Built Since 2010, by Zip Code (ZCTA5) — Houston Metro
- Housing % of Units Built Since 2010, by Zip Code (ZCTA5) — Miami Metro
- Housing % of Units Built Since 2010, by Zip Code (ZCTA5) — Boston Metro
- Housing % of Units Built Since 2010, by Zip Code (ZCTA5) — Detroit Metro
- Housing % of Units Built Since 2010, by Zip Code (ZCTA5) — Tampa Metro
- Housing % of Units Built Since 2010, by Zip Code (ZCTA5) — Louisiana
- Housing % of Units Built Since 2010, by Zip Code (ZCTA5) — Denver Metro
- Housing % of Units Built Since 2010, by Zip Code (ZCTA5) — Chicago Metro
- Housing % of Units Built Since 2010, by Zip Code (ZCTA5) — Dallas Metro
- Housing % of Units Built Since 2010, by Zip Code (ZCTA5) — Seattle Metro