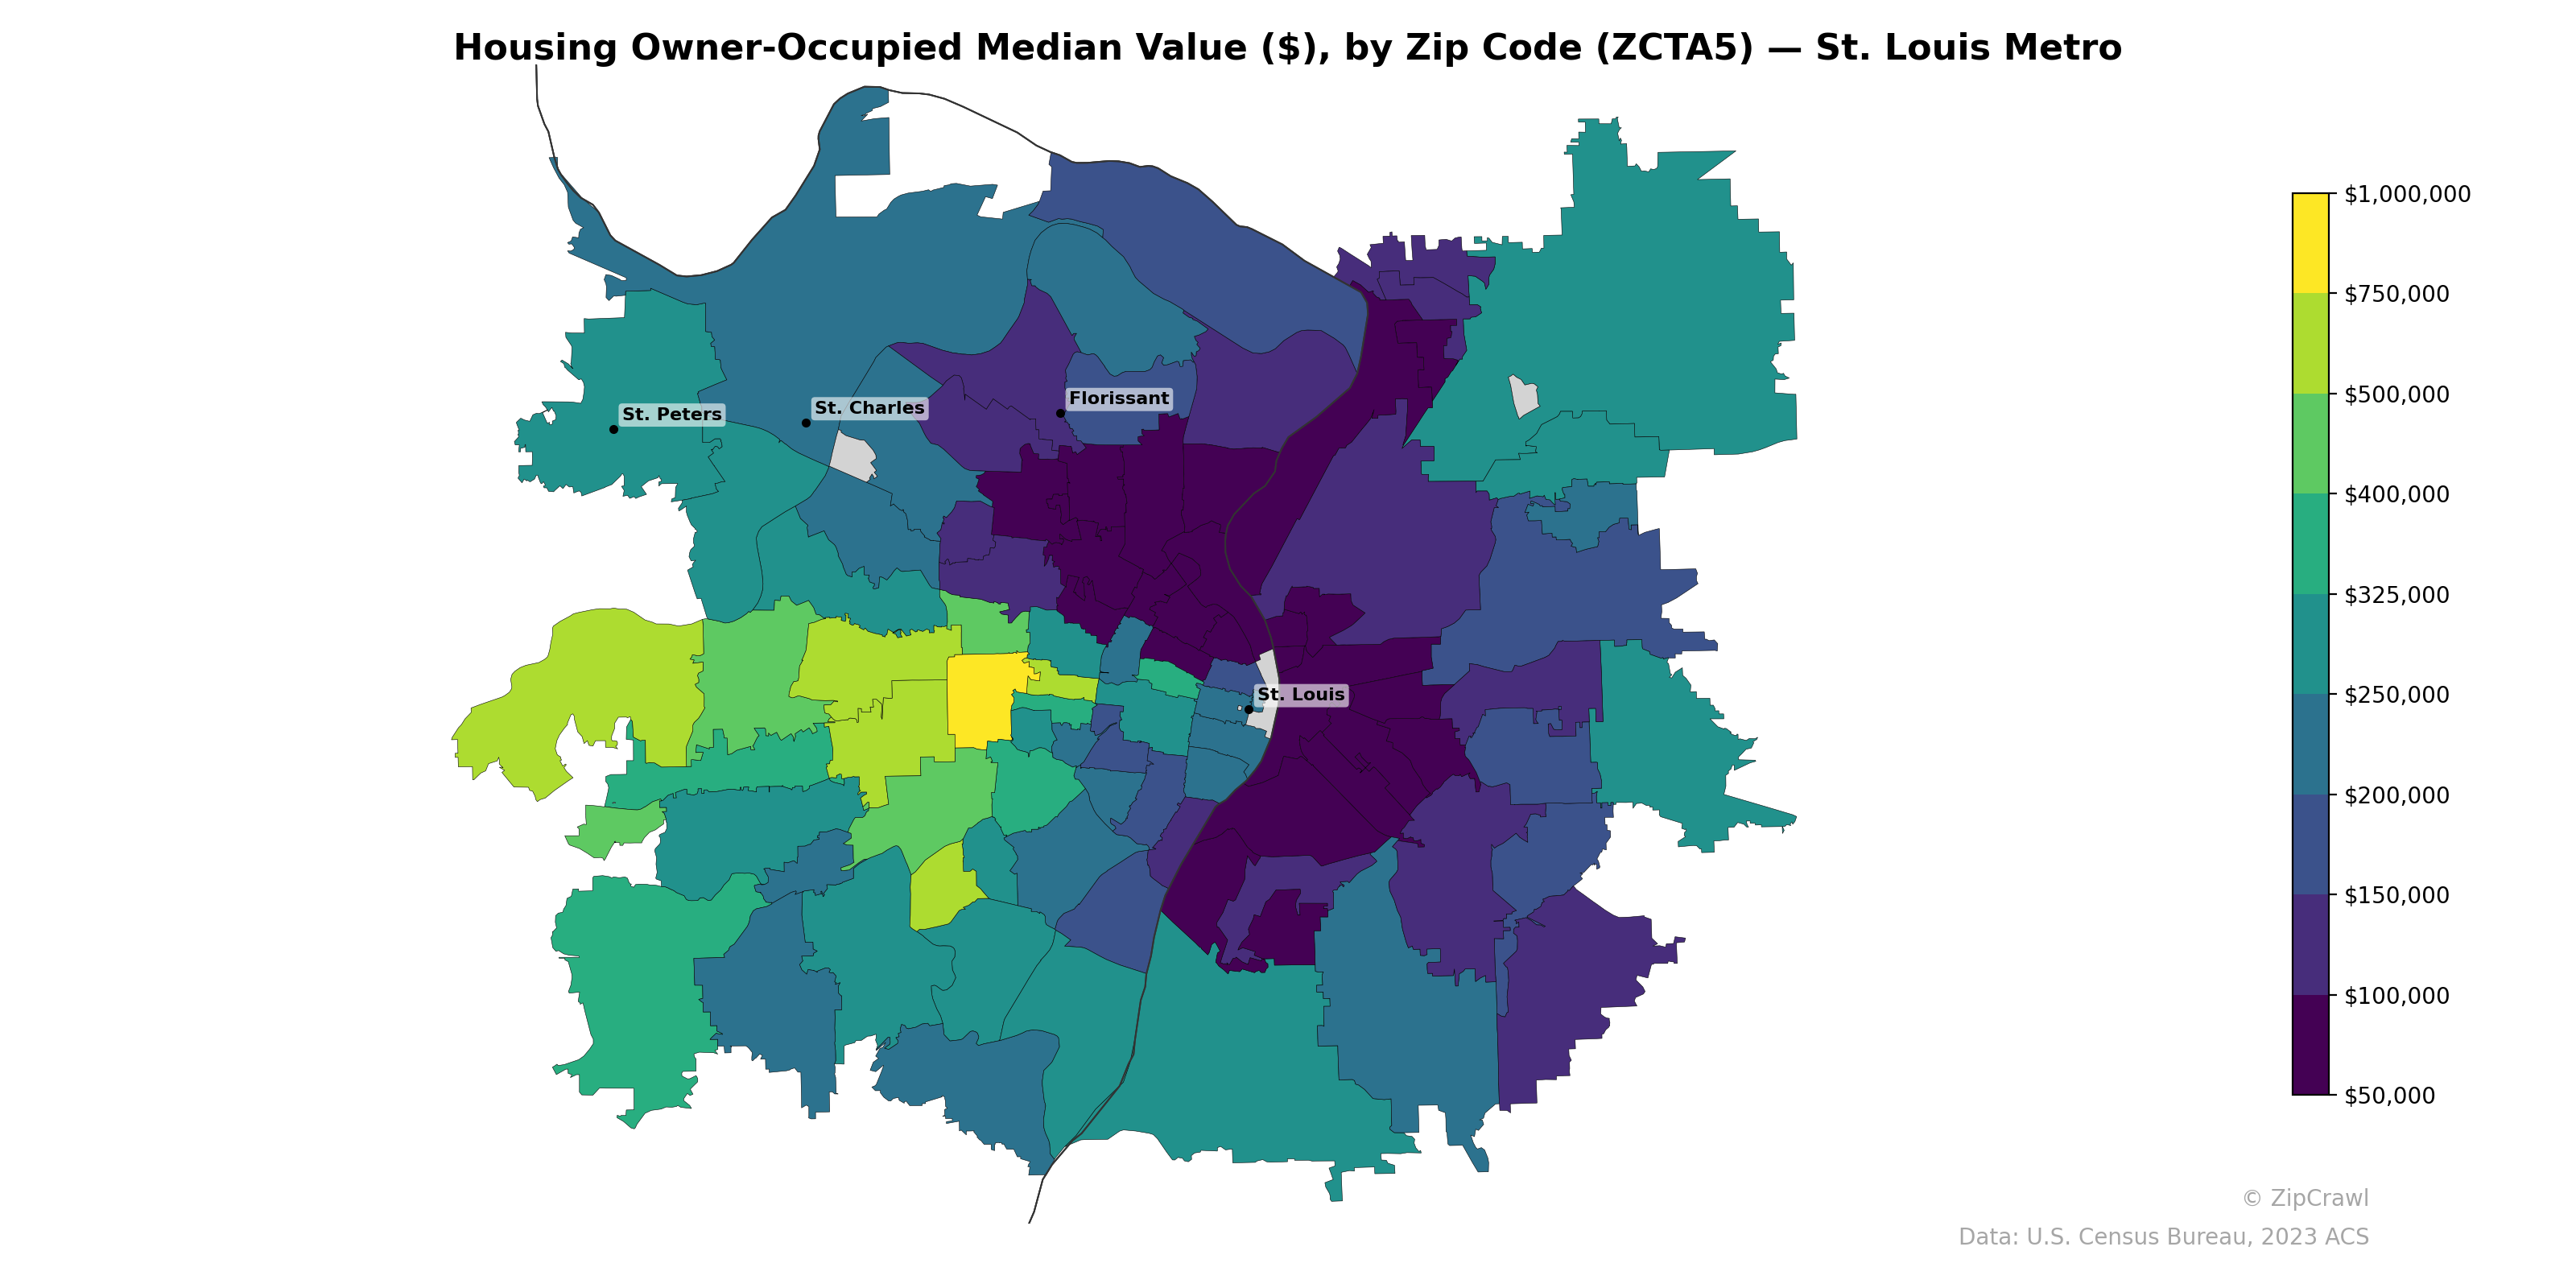
NOTE: Gray indicates insufficient data or a suppressed estimate.
Median owner-occupied home values in the St. Louis metro area exhibit a stark east-west divide, with the lowest values—often below $100,000—concentrated in north St. Louis city and the near-north suburbs around Florissant, while the highest values exceeding $400,000 cluster in the western and southwestern suburbs. A notable pocket of elevated home values approaching $750,000–$1,000,000 appears in the west-central portion of the metro, likely corresponding to affluent communities such as Wildwood and Chesterfield. The St. Charles and St. Peters corridor to the northwest maintains moderate values in the $250,000–$325,000 range, serving as a transitional zone between the high-value western suburbs and the more affordable northern areas.
Data: U.S. Census Bureau, 2023 ACS
Explore
- Household Median Income by Zip Code (ZCTA5) — Texas
- Housing Vacancy Rate by Zip Code (ZCTA5) — St. Louis Metro
- % of Population without Health Insurance, by Zip Code (ZCTA5) — St. Louis Metro
- Housing Owner-Occupied % of Units, by Zip Code (ZCTA5) — St. Louis Metro
- Married Couple (% of all Households) by Zip Code (ZCTA5) — St. Louis Metro
- Housing Median Monthly Rent ($), by Zip Code (ZCTA5) — St. Louis Metro
- Housing % of Units Built Since 2010, by Zip Code (ZCTA5) — St. Louis Metro
- % of Households with Broadband Internet, by Zip Code (ZCTA5) — St. Louis Metro
- Household Average Size by Zip Code (ZCTA5) — St. Louis Metro
- Bachelor's Degree or Higher (% of Over 25) by Zip Code (ZCTA5) — St. Louis Metro
- High School Graduate (% of Over 25) by County
- Population Non-Hispanic White % by Zip Code (ZCTA5) — Texas
- U.S. Citizens (% of Population Over 18) by Zip Code (ZCTA5) — Texas
- Population Non-Hispanic Asian % by Zip Code (ZCTA5) — Chicago Metro
- Housing Median Monthly Rent ($), by Zip Code (ZCTA5) — New York Metro
- % of Population on Food Stamps or SNAP (Last 12 Months), by Zip Code (ZCTA5) — Chicago Metro
- Population Non-Hispanic Black % by Zip Code (ZCTA5) — Texas
- Population Hispanic % by Zip Code (ZCTA5) — Texas
- Population Non-Hispanic American Indian % by Zip Code (ZCTA5) — Texas
- Median Age by Zip Code (ZCTA5) — Texas
- High School Graduate (% of Over 25) by Zip Code (ZCTA5) — Texas
- % of Households with Broadband Internet, by Zip Code (ZCTA5) — Baltimore Metro
- Bachelor's Degree or Higher (% of Over 25) by Zip Code (ZCTA5) — Baltimore Metro
- % of Population without Health Insurance, by Zip Code (ZCTA5) — Baltimore Metro
- Population Non-Hispanic Asian % by Zip Code (ZCTA5) — Charlotte Metro
- Population Non-Hispanic Asian % by Zip Code (ZCTA5) — Baltimore Metro
- Household Median Income by Zip Code (ZCTA5) — Baltimore Metro
- High School Graduate (% of Over 25) by Zip Code (ZCTA5) — Baltimore Metro
- % of Population on Food Stamps or SNAP (Last 12 Months), by Zip Code (ZCTA5) — Charlotte Metro
- Population Non-Hispanic Black % by Zip Code (ZCTA5) — Baltimore Metro
- Housing Owner-Occupied Median Value ($), by Zip Code (ZCTA5) — Louisiana
- Housing Owner-Occupied Median Value ($), by Zip Code (ZCTA5) — Houston Metro
- Housing Owner-Occupied Median Value ($), by Zip Code (ZCTA5) — Miami Metro
- Housing Owner-Occupied Median Value ($), by Zip Code (ZCTA5) — Seattle Metro
- Housing Owner-Occupied Median Value ($), by Zip Code (ZCTA5) — Boston Metro
- Housing Owner-Occupied Median Value ($), by Zip Code (ZCTA5) — Detroit Metro
- Housing Owner-Occupied Median Value ($), by Zip Code (ZCTA5) — Denver Metro
- Housing Owner-Occupied Median Value ($), by Zip Code (ZCTA5) — Tampa Metro
- Housing Owner-Occupied Median Value ($), by Zip Code (ZCTA5) — San Diego Metro
- Housing Owner-Occupied Median Value ($), by Zip Code (ZCTA5) — Chicago Metro