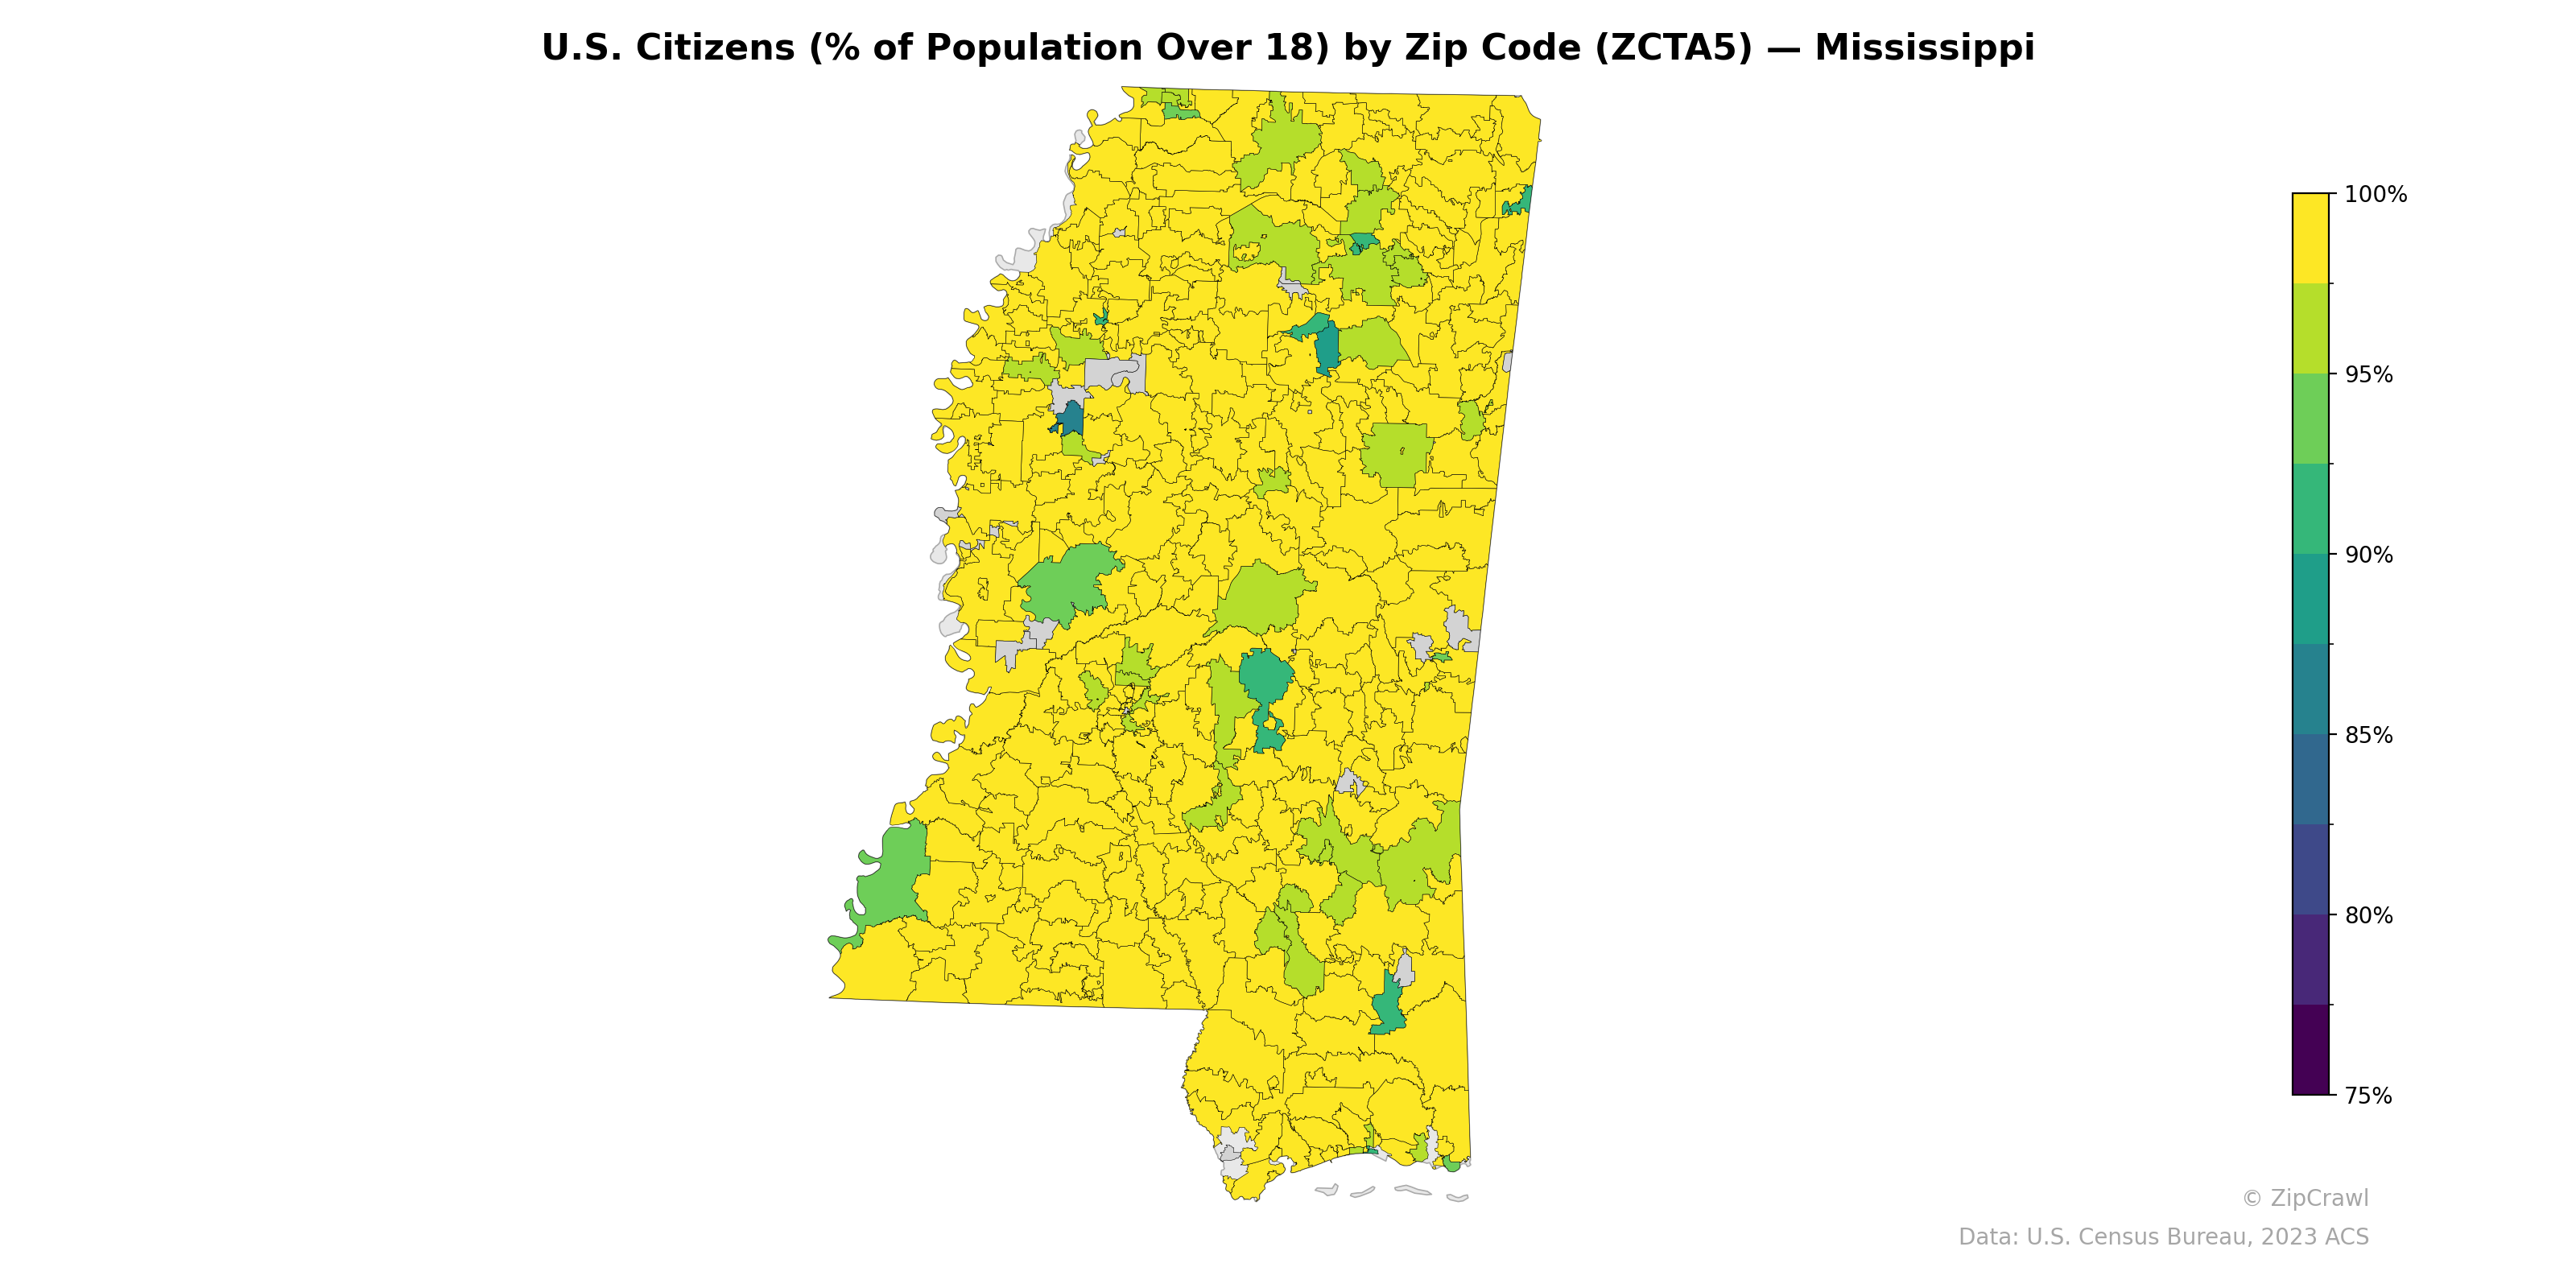
NOTE: Gray indicates insufficient data or a suppressed estimate.
The vast majority of Mississippi zip codes report U.S. citizenship rates above 95% among the adult population, with nearly uniform yellow shading across the state. Notable exceptions cluster around the Delta region in the west-central part of the state and scattered areas near Tupelo in the northeast, where several zip codes dip into the 85–93% range, likely reflecting concentrated immigrant labor communities tied to poultry processing and agriculture. A few zip codes in the central part of the state near the Jackson metropolitan area and along the Gulf Coast also display moderately lower citizenship rates, with at least one coastal zip code approaching the 75% threshold.
Data: U.S. Census Bureau, 2023 ACS
Explore
- High School Graduate (% of Over 25) by Zip Code (ZCTA5) — Florida
- Population Non-Hispanic Black % by Zip Code (ZCTA5) — Mississippi
- % of Population on Food Stamps or SNAP (Last 12 Months), by Zip Code (ZCTA5) — Arkansas
- Population Non-Hispanic Asian % by Zip Code (ZCTA5) — Arkansas
- Married Couple (% of all Households) by Zip Code (ZCTA5) — Arkansas
- Population Hispanic % by Zip Code (ZCTA5) — Mississippi
- Population Non-Hispanic White % by Zip Code (ZCTA5) — Mississippi
- Median Age by Zip Code (ZCTA5) — Mississippi
- Household Median Income by Zip Code (ZCTA5) — Mississippi
- Housing Vacancy Rate by Zip Code (ZCTA5) — Arkansas
- Housing Owner-Occupied Median Value ($), by County
- Housing Owner-Occupied Median Value ($), by Zip Code (ZCTA5) — Miami Metro
- Population Non-Hispanic American Indian % by Zip Code (ZCTA5) — Florida
- Median Age by Zip Code (ZCTA5) — Florida
- Population Non-Hispanic White % by Zip Code (ZCTA5) — Florida
- Population Hispanic % by Zip Code (ZCTA5) — Florida
- Household Median Income by Zip Code (ZCTA5) — Florida
- Population Non-Hispanic Asian % by Zip Code (ZCTA5) — California
- % of Population on Food Stamps or SNAP (Last 12 Months), by Zip Code (ZCTA5) — California
- Housing Owner-Occupied Median Value ($), by Zip Code (ZCTA5) — Pennsylvania
- Population Non-Hispanic Black % by Zip Code (ZCTA5) — Florida
- Household Average Size by Zip Code (ZCTA5) — Connecticut
- High School Graduate (% of Over 25) by Zip Code (ZCTA5) — Connecticut
- Married Couple (% of all Households) by Zip Code (ZCTA5) — Connecticut
- Housing Median Monthly Rent ($), by Zip Code (ZCTA5) — Nevada
- Household Median Income by Zip Code (ZCTA5) — Iowa
- Median Age by Zip Code (ZCTA5) — Iowa
- Bachelor's Degree or Higher (% of Over 25) by Zip Code (ZCTA5) — Connecticut
- Population Non-Hispanic American Indian % by Zip Code (ZCTA5) — Connecticut
- Housing Vacancy Rate by Zip Code (ZCTA5) — Connecticut
- U.S. Citizens (% of Population Over 18) by Zip Code (ZCTA5) — Missouri
- U.S. Citizens (% of Population Over 18) by Zip Code (ZCTA5) — Maine
- U.S. Citizens (% of Population Over 18) by Zip Code (ZCTA5) — Ohio
- U.S. Citizens (% of Population Over 18) by Zip Code (ZCTA5) — Utah
- U.S. Citizens (% of Population Over 18) by Zip Code (ZCTA5) — Michigan
- U.S. Citizens (% of Population Over 18) by Zip Code (ZCTA5) — Oregon
- U.S. Citizens (% of Population Over 18) by Zip Code (ZCTA5) — Iowa
- U.S. Citizens (% of Population Over 18) by Zip Code (ZCTA5) — Minnesota
- U.S. Citizens (% of Population Over 18) by Zip Code (ZCTA5) — Montana
- U.S. Citizens (% of Population Over 18) by Zip Code (ZCTA5) — Texas